| |
Manhattan Hotel Market Overview
HVS International, in
cooperation with New York University’s Preston Robert Tisch Center
for Hospitality, Tourism, and Sports Management, is pleased to present
the seventh annual Manhattan Hotel Market Overview.
Findings of our 2003 Manhattan Hotel Market Overview reveal that despite
a RevPAR decline of 1.4% for the year, composed of a 1.0% growth in
occupancy and a 2.3% decline in average rate, 2003 ended on a very positive
note for the Manhattan lodging market. While the first half of the year
was severely impacted by the adverse effects on travel due to the war
in Iraq and the outbreaks of the SARS epidemic, demand levels in Manhattan
started rising in June, with overall occupancy increasing from four
to six percent in each month through the end of the year. With demand
compression increasing, average rate showed positive growth in October
through December. Overall, RevPAR registered strong increases in the
last four months of the year, rising at rates ranging from seven to
nine percent in each month.
Based on the market’s strong fourth quarter results, an overall
improved economic climate, and the expected year-over-year growth in
the first four months of 2004, as a result of the market’s poor
performance during that period in 2003, we forecast the Manhattan lodging
market to achieve a robust 7.8% RevPAR growth in 2004. As the national
economy continues to recover, we project that by 2006, Manhattan’s
occupancy will reach close to 1999 levels and average rate will return
to 2000 levels.
HVS
International
HVS International is a global consulting and services organization focused
on the hotel, restaurant, timeshare, gaming, and leisure industries. Its
clients rely on the firm’s specialized industry knowledge and expertise
for advice and services geared to enhance economic returns and asset value.
Through a network of 22 offices staffed by more than 200 seasoned industry
professionals, HVS offers a wide scope of services that track the development/ownership
process.
Starting with the market feasibility and appraisal study,
a project is conceived and justified. Financing through the HVS investment
banking team is then arranged, interiors designed, and management hired.
The latest technology solutions are implemented, marketing strategies
developed, and organizational assessments made. When a client requires
actual, on-site hotel or restaurant management, HVS offers these services
as well. Lastly, HVS asset management provides constant operational oversight
that ensures the maximization of economic returns and asset value. No
other organization offers such a broad range of complementary services.
HVS also has specialists in parking operations, golf courses, and convention
centers.
Since 1980, HVS International has performed more than
15,000 assignments throughout the world for virtually every major industry
participant. Its principals literally “wrote the book” on hospitality
consulting, authoring numerous authoritative texts and hundreds of articles.
HVS is client driven, entrepreneurial, and dedicated to providing the
best advice and services in a timely and cost efficient manner.
The
Preston Robert Tisch Center for Hospitality, Tourism, and Sports Management
at New York University is a dynamic and growing educational and research
center located in the heart of Manhattan. The Tisch Center offers an extensive
complement of hospitality and tourism academic programs of study, including
two bachelor’s degree programs and five master’s degree programs
(three on-site and two online). In concert with its location in the financial
and hotel capital of the world, coursework is focused on the areas of
hospitality investments, hotel operations, revenue management, and customer
relationship management relative to the international hospitality and
tourism industry. As entrepreneurial educators, administrators and faculty
are experienced in the profession and bring the reality of the industry
into the classroom. The Tisch Center’s motto encapsulates its uniqueness
— The City is our laboratory, the industry is our faculty, and our
students are the future of the profession.
New York University Annual International
Hospitality Investment Conference
For 21 years, HVS International
has played an integral role in New York University’s Annual International
Hospitality Industry Investment Conference. Once again, our team of professionals
looks forward to welcoming you to this prestigious event, which is scheduled
for Sunday – Tuesday, June 6 - 8, 2004, at New York City’s Waldorf
Astoria Hotel.
Acknowledgements
Randy Smith of Smith
Travel Research has provided the Survey’s comprehensive hotel
statistics of Manhattan. Smith Travel Research continues to be the leading
source of hospitality industry operating statistics. We would also like
to thank Joseph E. Spinnato and Rick Amatto of the Hotel Association of
New York City for their assistance. Additionally, in cooperation with
New York University, the data-gathering process was largely a contribution
of two graduate students, Michael Parys and Nimeet Patel, through the
coordination of Dr. Mark M. Warner,
Director of Graduate Programs. HVS
International is pleased to have been a part of this enriching educational
process.
Manhattan Operating History
The following table illustrates aggregate occupancies
and average rates for contributing Manhattan hotels since 1987, as compiled
by Smith Travel Research
(STR). The table also summarizes marketwide rooms revenue per available
room (RevPAR); this figure, which is calculated by multiplying occupancy
by average rate, provides an indication of how well rooms revenue is being
maximized.
| Year |
�No. of Rooms |
% Change |
� Occupied Rooms |
% Change |
Occupancy |
% Change |
��Average Rate |
% Change |
�RevPAR� |
% Change |
|
1987
|
51,785
|
---
|
14,367,318
|
---
|
76.0 %
|
---
|
$114.66
|
---
|
$87.15
|
---
|
|
1988
|
51,870
|
0.2 %
|
14,403,588
|
0.3 %
|
76.1
|
0.1 %
|
121.67
|
6.1 %
|
92.56
|
6.2 %
|
|
1989
|
51,724
|
(0.3)
|
13,572,726
|
(5.8)
|
71.9
|
(5.5)
|
132.88
|
9.2
|
95.53
|
3.2
|
|
1990
|
53,348
|
3.1
|
13,853,761
|
2.1
|
71.1
|
(1.0)
|
131.54
|
(1.0)
|
93.59
|
(2.0)
|
|
1991
|
54,090
|
1.4
|
13,204,783
|
(4.7)
|
66.9
|
(6.0)
|
127.14
|
(3.3)
|
85.04
|
(9.1)
|
|
1992
|
55,477
|
2.6
|
13,603,539
|
3.0
|
67.2
|
0.4
|
126.19
|
(0.7)
|
84.78
|
(0.3)
|
|
1993
|
55,426
|
(0.1)
|
14,137,222
|
3.9
|
69.9
|
4.0
|
127.86
|
1.3
|
89.35
|
5.4
|
|
1994
|
55,794
|
0.7
|
15,156,219
|
7.2
|
74.4
|
6.5
|
135.06
|
5.6
|
100.52
|
12.5
|
|
1995
|
56,292
|
0.9
|
15,798,383
|
4.2
|
76.9
|
3.3
|
146.96
|
8.8
|
113.00
|
12.4
|
|
1996
|
56,534
|
0.4
|
16,666,418
|
5.5
|
80.8
|
5.0
|
161.53
|
9.9
|
130.46
|
15.5
|
|
1997
|
57,406
|
1.5
|
17,094,812
|
2.6
|
81.6
|
1.0
|
178.20
|
10.3
|
145.39
|
11.4
|
|
1998
|
58,016
|
1.1
|
17,438,157
|
2.0
|
82.3
|
0.9
|
199.49
|
11.9
|
164.28
|
13.0
|
|
1999
|
59,608
|
2.7
|
17,657,134
|
1.3
|
81.2
|
(1.4)
|
209.52
|
5.0
|
170.04
|
3.5
|
|
2000
|
61,115
|
2.5
|
18,671,091
|
5.7
|
83.7
|
3.1
|
223.75
|
6.8
|
187.28
|
10.1
|
|
2001
|
62,859
|
2.9
|
17,089,561
|
(8.5)
|
74.5
|
(11.0)
|
196.76
|
(12.1)
|
146.56
|
(21.7)
|
|
2002
|
63,501
|
1.0
|
17,354,297
|
1.5
|
74.9
|
0.5
|
186.89
|
(5.0)
|
139.93
|
(4.5)
|
|
2003
|
64,674
|
1.8
|
17,846,423
|
2.8
|
75.6
|
1.0
|
182.53
|
(2.3)
|
137.99
|
(1.4)
|
Average Annual
Compounded Change: |
1.4 %
|
|
1.4 %
|
|
0.0 %
|
|
2.9 %
|
|
2.9 %
|
|
Source: Smith Travel Research
* Some figures may be subject to small rounding errors
|
Jonathan M. Tisch
Chairman,
NYC &
Company
New York City continues to be a major visitor destination for domestic
and international travelers, in fact, we hold the position as the top
U.S. destination for overseas visitors. After a few trying years for the
travel industry, improving national and global economic conditions, coupled
with the weak dollar, are generating a travel and tourism resurgence.
The visitor volume New York City experienced in the fourth quarter of
2003, continued through the first three months of the year with strong
hotel occupancy figures. The good news in the tourism industry is even
better news for New York City, as visitor spending supports hundreds of
thousands of jobs in all five boroughs.
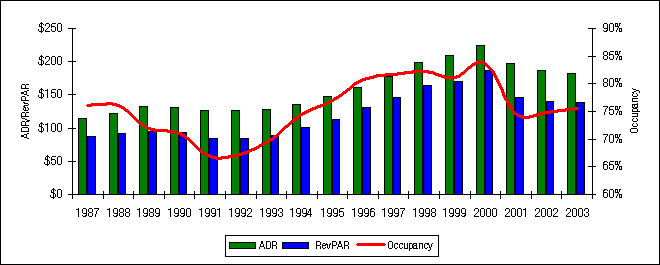
The Manhattan hotel market has experienced dramatic cycles
since the late 1980s. A significant downturn occurred in the early 1990s,
reflecting the combined impact of supply additions, the nationwide recession,
several disappointing years in the financial markets, and the Persian
Gulf War; the result was a substantial decline in both occupancy and RevPAR.
Signs of true recovery began to appear in 1993, and by the end of 1994,
it was clear that a dramatic improvement in the market was underway. With
the exception of 1999, which saw a substantial increase in supply, overall
RevPAR registered double-digit growth each year from 1994 through 2000.
A second significant downturn started in 2001, as a result of the slowdown
in the national and regional economies, as well as the September 11 terrorist
attacks; the result was even more dramatic than that of the previous recession,
with a RevPAR decline of 21.7%. In 2002, marketwide occupancy rose slightly,
as many hotels in the market employed a strategy of aggressive rate discounts
to stimulate demand and maintain occupancy levels; marketwide average
rate decreased further, resulting in a RevPAR decline of 4.5% compared
to 2001. Despite a RevPAR decline of 1.4%, composed of a 1.0% growth in
occupancy and a 2.3% decline in average rate, 2003 ended on a very positive
note for the Manhattan lodging market. While the first half of the year
was severely impacted by the adverse effects on travel due to the war
in Iraq and the outbreaks of the SARS epidemic, demand levels in Manhattan
started rising in June, with overall occupancy increasing from four to
six percent in each month through the end of the year. With demand compression
increasing, average rate showed positive growth in October through December.
Overall, RevPAR registered strong increases in the last four months of
the year, rising at rates ranging from seven to nine percent in each month.
The following chart illustrates the Manhattan lodging market performance
from 1987 through 2003.
Mark Lomanno
President,
Smith Travel Research
Accelerating room night demand trends are propelling the New York hotel
market into a period of sustained growth. With stronger demand for rooms
during the business travel days of Monday through Thursday augmenting
the already strong leisure weekend travel days, occupancy levels in 2004
will be at their highest since 2000.
New Supply
In 2003, six new hotels entered the Manhattan market, including the
120-room Maritime Hotel, the 182-room La Quinta Inn, the 144-room Hampton
Inn Chelsea, the 251-room Mandarin Oriental, the 158-room Sheraton Four
Points, and the 203-room Alex. We note that the opening of the La Quinta
Inn, Sheraton Four Points, and the Hampton Inn marked the first representation
of these three brands in Manhattan. In addition, two hotels reopened
in May of 2003. The 561-room Millenium Hilton reopened following comprehensive
renovations as a result of the damages caused by the terrorist attacks
of September 11, 2001, and the San Carlos reopened following a 15-month
renovation and repositioning program. Unlike 2002, where over 80% of
new supply was located in the Midtown West and the Downtown areas, openings
in 2003 were dispersed throughout Manhattan, specifically in Midtown
West, Midtown East, Lower, and Downtown Manhattan. We note that the
Helmsley Windsor Hotel and the Regent Wall Street closed in late 2003;
both properties are expected to be converted into luxury condominiums.
The 188-room Doral Park Avenue closed in November of 2003 to undergo
a $19-million renovation and expansion program, including the addition
of 17 guestrooms. Upon completion of the project, the property will
be repositioned as an upscale boutique hotel and affiliated with Kimpton
Hotels. The following table lists some of the significant changes in
the Manhattan hotel supply that have occurred in recent years.
| Name of Hotel |
Location |
Type |
No. of Rooms |
Opening Date� |
Developer / Comments |
| Midtown West |
|
|
|
|
|
| Holiday Inn |
32nd St. & Broadway |
Midscale |
531
|
Sep-98
|
Thurcon Properties |
| Courtyard by Marriott |
114 W. 40th St. (Broadway & 6th Ave.) |
Midscale |
244
|
Nov-98
|
Granite Park (Harry Gross) |
| Millennium Broadway Addition |
44th St. (Broadway & 6th Ave.) |
Luxury |
125
|
Nov-98
|
CDL Hotels |
| Time Hotel |
224 West 49th Street |
Boutique |
192
|
Jun-99
|
Hampshire Hotels, renov. of Consulate Hotel |
| Philips Club Addition |
Broadway & 67th Street |
Timeshare |
92
|
Nov-99
|
Millennium Partners |
| On the Ave |
Broadway & 77th Street |
Midscale |
250
|
Dec-99
|
PMG |
| Herald Hotel |
34th St. & Broadway, SE corner |
Extended-Stay |
60
|
Jan-00
|
JEMB Realty |
| St Moritz - Closed |
6th Avenue & Central Park South |
Midscale |
(689)
|
Jan-00
|
Millennium Partners |
| Red Roof Inn |
6 West 32nd Street |
Economy |
171
|
Jun-00
|
Apple Core Hotels |
| Hilton Times Square |
42nd St. (between 7th & 8th Aves.) |
Upscale |
455
|
Jun-00
|
Forest City Ratner |
| Sofitel |
44th St. (between 5th & 6th Aves.) |
Upscale |
398
|
Jul-00
|
Accor |
| The Muse |
130 West 46th Street |
Boutique |
200
|
Aug-00
|
Cornerstone |
| Hudson Hotel |
57th St. (between 8th & 9th Aves.) |
Midscale |
810
|
Nov-00
|
Ian Schrager Hotels |
| Bryant Park Hotel |
40th St. (between 5th & 6th Aves.) |
Boutique |
130
|
Feb-01
|
Pilevsky & McNally |
| The Chambers Hotel |
56th St. (between 5th & 6th Aves.) |
Boutique |
77
|
Feb-01
|
Ira Drukier and Richard Born |
| Comfort Inn |
442 W. 36th (between 9th & 10th Aves.) |
Economy |
56
|
Jun-01
|
Heena Hotel, LLC |
| W Times Square |
47th St. & Broadway (SW corner) |
Boutique |
509
|
Dec-01
|
Intell Real Estate/Starwood |
| Best Western |
522-24 W. 38th St. (bet. 10th & 11th Aves.) |
Economy |
83
|
Jan-02
|
Unigroup Hotel, LLC |
| City Club Hotel |
55 West 44th Street |
Boutique |
65
|
Jan-02
|
Metropolitan Hotels, LLC |
| Ritz-Carlton |
50 Central Park South |
Luxury |
277
|
May-02
|
Millennium Partners |
| Hotel 41 |
216 West 41st Street |
Boutique |
47
|
Aug-02
|
Private Investment Group |
| Westin Times Square |
270 43rd St. & 8th Avenue |
Upscale |
863
|
Oct-02
|
Tishman Urban Development Corporation |
| Hampton Inn |
W. 24th Street� (between 6th & 7th Ave.) |
Midscale |
144
|
Aug-03
|
Hersha Hospitality |
| Mandarin Oriental |
10 Columbus Circle |
Luxury |
251
|
Nov-03
|
Related Co./Mandarin Oriental Hotels |
| The Helmsley Windsor Hotel - Closed |
100 West 58th Street |
Upscale |
(240)
|
Nov-03
|
Conversion to residential use |
| Midtown East |
|
|
|
|
|
| Peninsula - Closed |
5th Avenue & 55th Street |
Luxury |
(242)
|
Jan-98
|
Closed for renovation |
| Beverly Hotel - Closed |
50th Street & Lexington Avenue |
All-Suite |
(186)
|
Jan-98
|
Manhattan East Suites buys and closes |
| Avalon Hotel |
16 East 32nd Street |
Boutique |
100
|
Apr-98
|
Not Available |
| Fitzpatrick Grand Central Hotel |
44th Street (Lexington & 3rd Avenue) |
Boutique |
155
|
Sep-98
|
Fitzpatrick Hotels |
| Courtyard by Marriott |
53rd Street & 3rd Avenue |
Midscale |
320
|
Nov-98
|
Witkoff Group |
| Peninsula - Reopened |
5th Avenue & 55th Street |
Luxury |
242
|
Jan-99
|
Reopened after renovation |
| Benjamin Hotel (formerly Beverly) |
50th Street & Lexington Avenue |
All-Suite |
209
|
Apr-99
|
Reopened after a $40,000,000 renovation |
| Hotel Giraffe |
Park Avenue So. & 26th Street |
Boutique |
73
|
Dec-99
|
Henry Kallan |
| Habitat |
57th Street & Lexington Avenue |
Economy |
220
|
Dec-99
|
PMG |
| Thirty Thirty |
East 29th St. (bet. Park & Lexington Aves.) |
Midscale |
251
|
Jul-00
|
PMG |
| Library Hotel |
299 Madison Ave. at 41st St. |
Boutique |
60
|
Aug-00
|
Henry Kallan |
| Dylan Hotel |
52 East 41st Street |
Boutique |
107
|
Oct-00
|
Morris Moinian/Allied Hospitality |
| Park South Hotel |
122 East 28th Street |
Boutique |
143
|
Sep-01
|
Atlantic Stars |
| Le Marquis |
12 East 31st Street |
Boutique |
123
|
Sep-01
|
Le Marquis Associates |
| The San Carlos - Closed |
150 East 50th Street |
Boutique |
(147)
|
Feb-02
|
$22-million renovation |
| The Alex |
205 East 45th Street |
Boutique |
203
|
Sep-03
|
Izak Senbahar/Simon Elias |
| Doral Park - Closed |
70 Park Avenue |
Midscale |
(188)
|
Nov-03
|
Conversion to Kimpton Hotel |
| The San Carlos - Reopened |
150 East 50th Street |
Boutique |
147
|
May-03
|
San Carlos Hotel, Inc. |
| Upper West Side |
|
|
|
|
|
| Quality Inn |
94th St. & Broadway |
Midscale |
251
|
Jun-99
|
Hampshire Hotels |
| Hotel 71 (Comfort Inn) |
31 West 71st Street |
Midscale |
88
|
Jun-99
|
Hampshire Hotels |
| Empire Hotel - Closed� |
44 West 63rd Street |
Boutique |
(381)
|
Dec-03
|
Converted to residential use |
| Upper East Side |
|
|
|
|
|
| The Melrose Hotel (formerly Barbizon) |
140 East 63rd Street |
Upscale |
306
|
Jun-02
|
The Melrose Hotel Company |
| Hotel Delmonico - Closed |
Park Ave. and 59th Street |
All-Suite |
(152)
|
Apr-02
|
Converted to residential use |
| SoHo/Lower Manhattan |
|
|
|
|
|
| Mercer Hotel |
Prince & Mercer Streets |
Boutique |
75
|
Jan-98
|
Balaz & Partners |
| TriBeCa Grand |
6th & White Streets |
Boutique |
203
|
May-00
|
Hartz Mountain Industries |
| W Hotel |
Union Square, Park Ave. So. & 15th St. |
Boutique |
270
|
Nov-00
|
Starwood/Related Cos. |
| 60 Thompson St. |
60 Thompson Street |
Boutique |
101
|
Feb-01
|
Pomeranc Group |
| Maritime Hotel |
Ninth Ave (between 16th and 17th St.) |
Boutique |
120
|
Jun-03
|
Private Developers |
| Sheraton Four Points |
West 25th Street |
Midscale |
158
|
Dec-03
|
Unigroup Hotel, LLC |
| Downtown |
|
|
|
|
|
| Holiday Inn |
Gold & Platt Streets |
Midscale |
138
|
Jul-99
|
RD Management |
| Wall Street Inn |
9 South William Street |
Boutique |
46
|
Jul-99
|
Norman Rutta |
| Regent Hotel |
55 Wall Street |
Luxury |
144
|
Dec-99
|
Sidney Kimmel, Jones NY |
| Embassy Suites |
Battery Park City |
All-Suite |
463
|
Jun-00
|
Forest City Ratner |
| Embassy Suites - Closed |
Battery Park City |
All-Suite |
(463)
|
Sep-01
|
Forest City Ratner |
| Millenium Hilton - Closed |
55 Church Street |
Upscale |
(561)
|
Sep-01
|
CDL Hotels |
| Marriott Financial Center - Closed |
85 West Street |
Upscale |
(504)
|
Sep-01
|
Host Marriott Corporation |
| Marriott World Trade Center - Destroyed |
3 World Trade Center |
Upscale |
(818)
|
Sep-01
|
Host Marriott Corporation |
| Howard Johnson� |
135 East Houston |
Economy |
46
|
Dec-01
|
Metro One Hotel, LLC |
| Ritz Carlton Battery Park |
2 West Street |
Luxury |
298
|
Jan-02
|
Millennium Partners |
| Marriott Financial Center - Reopened |
85 West Street |
Upscale |
504
|
Jan-02
|
Host Marriott Corporation |
| Embassy Suites - Reopened |
Battery Park City |
All-Suite |
463
|
May-02
|
Forest City Ratner |
| Millenium Hilton - Reopened |
55 Church Street |
Upscale |
561
|
May-03
|
CDL Hotels |
| La Quinta Inn Manhattan |
17 West 32nd Street |
Economy |
182
|
May-03
|
Not Available |
| Regent Hotel - Closed |
55 Wall Street |
Luxury |
(144)
|
Dec-03
|
Conversion to residential use |
Proposed Hotels
As illustrated in the table below, as many as 1,918 rooms, or 13 properties,
may enter the Manhattan market through 2006. We note that we have not
factored in the Courtyard by Marriott, which is expected to be located
at 54th and Broadway, as it was on hold as of the time of our survey.
We also note that the 357-room Residence Inn, which is under construction
at 39th Street and Sixth Avenue, will be the first branded extended-stay
product in Manhattan. The majority of the anticipated new supply represents
limited-service hotels. We further note that significant barriers to
entry including high construction costs, prohibitive land costs, and
a lack of available sites continue to remain key factors when considering
construction of lodging facilities in Manhattan. Thus, only the most
financially feasible projects are likely to reach fruition. The following
table sets forth the number of new rooms that are anticipated to become
available through 2006.
| Project |
Location |
Type |
No. of Rooms |
Anticipated Opening |
Developer |
Rating |
| Midtown West |
|
|
|
|
|
|
| Hampton Inn |
W. 31st Street� (between 6th & 7th Ave.) |
Mid-scale |
136
|
Spring 04
|
Hersha Hospitality |
5
|
| Residence Inn |
39th Street & 6th Avenue |
Extended-Stay |
357
|
Nov-05
|
Harry Gross |
5
|
| Courtyard by Marriott |
NW Corner 54th & Broadway |
First Class |
200
|
Late 04
|
Harry Gross |
On Hold
|
| Wingate Inn |
35th Street (between 7th and 8th Ave.) |
Mid-scale |
97
|
Late 05
|
Private Developer |
1
|
| Holiday Inn Express |
39th Street & Eighth Ave. |
Mid-scale |
70
|
Jul-06
|
Metro One Hotels, LLC |
3
|
| Upper East Side |
|
|
|
|
|
|
| Courtyard by Marriott |
92nd Street & First Avenue |
First Class |
226
|
Sep-05
|
Madison Equities |
4
|
| Downtown |
|
|
|
|
|
|
| Hotel Gansevoort |
Ninth Ave and 13th Street |
Boutique |
187
|
Mar-04
|
WSA Management, Ltd. |
5
|
| Hilton Garden Inn |
York St. & Avenue of the Americas |
Mid-scale |
150
|
Mid-05
|
Meisel & Cohen |
3
|
| Hampton Inn |
320 Pearl Street |
Mid-scale |
65
|
Dec-04
|
Hersha Hospitality |
5
|
| The Surface Hotel |
107 Rivington Street |
Upscale Boutique |
115
|
Late 04
|
The Downtown LLC |
5
|
| Greenwich Village Hotel� |
Hudson and 13th Street |
Boutique |
195
|
Early 05
|
Madison Equities |
2
|
| Luxury Hotel |
TriBeCa |
Boutique |
83
|
Mid 05
|
Robert De Niro |
3
|
| Solita Hotel |
159 Grand Street |
Boutique |
42
|
May-04
|
Soho Grand Center, LLC |
5
|
| Holiday Inn Express |
29th Street & Seventh Ave. |
Mid-scale |
195
|
Late 06
|
Metro One Hotels, LLC |
3
|
| |
- 1 = Planning Stage
- 2 = Rumored development, less than 50% chance of reaching fruition
- 3 = Land acquired, no financing in place, likely to occur
- 4 = Financing in place, not under construction
- 5 = Under construction
- 6 = Reopening
|
Manhattan Operating Statistics (Class)
HVS International
compiled data provided by Smith
Travel Research to illustrate the effects of the current state of
the economy on different classes of hotels in Manhattan. The following
tables compare the performance of all reporting hotels in Manhattan for
year-end figures from 1998 through 2003; results are broken down by market
segment: luxury, boutique, first-class, and other.
Luxury
| Year |
Supply |
% Change |
Demand |
% Change |
Occupancy |
% Change |
ADR |
% Change |
RevPAR |
% Change |
|
1998
|
3,057,497
|
---
|
2,468,267
|
---
|
80.7 %
|
---
|
$323.28
|
---
|
$260.98
|
---
|
|
1999
|
3,143,924
|
2.8 %
|
2,471,243
|
0.1 %
|
78.6
|
(2.6) %
|
342.53
|
6.0 %
|
269.24
|
3.2 %
|
|
2000
|
3,208,546
|
2.1
|
2,600,330
|
5.2
|
81.0
|
3.1
|
366.08
|
6.9
|
296.69
|
10.2
|
|
2001
|
3,213,460
|
0.2
|
2,267,472
|
(12.8)
|
70.6
|
(12.9)
|
323.96
|
(11.5)
|
228.59
|
(23.0)
|
|
2002
|
3,402,140
|
5.9
|
2,473,393
|
9.1
|
72.7
|
3.0
|
310.67
|
(4.1)
|
225.86
|
(1.2)
|
|
2003
|
3,443,161
|
1.2
|
2,550,952
|
3.1
|
74.1
|
1.9
|
303.06
|
(2.4)
|
224.53
|
(0.6)
|
| Average Annual Compounded Change: |
2.4 %
|
|
0.7 %
|
|
(1.7) %
|
|
(1.3) %
|
|
(3.0) %
|
|
Source: Smith Travel Research
|
|
*Some figures may be subject to small rounding
errors
** Statistics based on selected hotels from a large database
|
Boutique
| Year |
Supply |
% Change |
Demand |
% Change |
Occupancy |
% Change |
ADR |
% Change |
RevPAR |
% Change |
|
1998
|
1,423,902
|
---
|
1,015,856
|
---
|
71.3 %
|
---
|
$216.70
|
---
|
$154.60
|
---
|
|
1999
|
1,436,540
|
0.9 %
|
1,133,123
|
11.5 %
|
78.9
|
10.6 %
|
240.37
|
10.9 %
|
189.60
|
22.6 %
|
|
2000
|
1,639,091
|
14.1
|
1,340,978
|
18.3
|
81.8
|
3.7
|
264.12
|
9.9
|
216.08
|
14.0
|
|
2001
|
2,116,690
|
29.1
|
1,487,760
|
10.9
|
70.3
|
(14.1)
|
223.84
|
(15.3)
|
157.33
|
(27.2)
|
|
2002
|
2,323,297
|
9.8
|
1,714,633
|
15.2
|
73.8
|
5.0
|
215.16
|
(3.9)
|
158.79
|
0.9
|
|
2003
|
2,318,845
|
(0.2)
|
1,733,837
|
1.1
|
74.8
|
1.3
|
215.34
|
0.1
|
161.01
|
1.4
|
| Average Annual Compounded Change: |
10.2 %
|
|
11.3 %
|
|
0.9 %
|
|
(0.1) %
|
|
0.8 %
|
|
Source: Smith Travel Research
|
|
*Some figures may be subject to small rounding
errors
** Statistics based on selected hotels from a large database
|
First-Class
| Year |
Supply |
% Change |
Demand |
% Change |
Occupancy |
% Change |
ADR |
% Change |
RevPAR |
% Change |
|
1998
|
6,832,435
|
---
|
5,610,514
|
---
|
82.1%
|
---
|
$209.44
|
---
|
$171.98
|
---
|
|
1999
|
6,894,146
|
0.9 %
|
5,558,280
|
(0.9) %
|
80.6
|
(1.8) %
|
218.11
|
4.1 %
|
175.85
|
2.2 %
|
|
2000
|
7,211,966
|
4.6
|
6,060,832
|
9.0
|
84.0
|
4.2
|
231.18
|
6.0
|
194.28
|
10.5
|
|
2001
|
7,223,057
|
0.2
|
5,539,796
|
(8.6)
|
76.7
|
(8.7)
|
203.95
|
(11.8)
|
156.42
|
(19.5)
|
|
2002
|
7,238,246
|
0.2
|
5,602,482
|
1.1
|
77.4
|
0.9
|
193.55
|
(5.1)
|
149.81
|
(4.2)
|
|
2003
|
7,623,793
|
5.3
|
5,921,303
|
5.7
|
77.7
|
0.3
|
186.20
|
(3.8)
|
144.62
|
(3.5)
|
| Average Annual Compounded Change: |
2.2 %
|
|
1.1 %
|
|
(1.1) %
|
|
(2.3) %
|
|
(3.4) %
|
|
Source: Smith Travel Research
|
|
*Some figures may be subject to small rounding
errors
** Statistics based on selected hotels from a large database
|
Other
| Year |
Supply |
% Change |
Demand |
% Change |
Occupancy |
% Change |
ADR |
% Change |
RevPAR |
% Change |
|
1998
|
4,582,296
|
---
|
3,883,954
|
---
|
84.8 %
|
---
|
$139.90
|
---
|
$118.58
|
---
|
|
1999
|
4,973,157
|
8.5 %
|
4,106,645
|
5.7 %
|
82.6
|
(2.6) %
|
146.64
|
4.8 %
|
121.09
|
2.1 %
|
|
2000
|
5,098,494
|
2.5
|
4,318,186
|
5.2
|
84.7
|
2.6
|
157.32
|
7.3
|
133.24
|
10.0
|
|
2001
|
5,145,757
|
0.9
|
3,845,982
|
(10.9)
|
74.7
|
(11.8)
|
138.98
|
(11.7)
|
103.87
|
(22.0)
|
|
2002
|
5,199,243
|
1.0
|
3,869,231
|
0.6
|
74.4
|
(0.4)
|
124.61
|
(10.3)
|
92.73
|
(10.7)
|
|
2003
|
5,214,455
|
0.3
|
3,903,231
|
0.9
|
74.9
|
0.6
|
122.00
|
(2.1)
|
91.32
|
(1.5)
|
| Average Annual Compounded Change: |
2.6 % |
|
0.1 %
|
|
(2.5) %
|
|
2.7 %
|
|
(5.1) %
|
|
Source: Smith Travel Research
|
|
*Some figures may be subject to small rounding
errors
** Statistics based on selected hotels from a large database
|
Stephen Rushmore
President and Founder,
HVS International
HVS International recognizes that the tourism industry is a prime economic generator for New York City. The year 2003 ended on an extremely positive note for the Manhattan lodging sector. Though the first six months of the year were severely impacted by the adverse effects on travel due to the war in Iraq and global uncertainty, demand levels started rising in June. Overall occupancy increased from four to six percent in each month through the end of the year. Based on the market�s strong fourth quarter results, an overall improved economic climate, and the expected year-over-year growth in the first four months of 2004, we forecast that the Manhattan lodging market will achieve robust growth in 2004. As the national economy continues to recover, we project that by 2006, NYC�s occupancy will achieve close to 1999 levels, and average rate will return to 2000 levels.
Real estate developers remain optimistic toward the Big Apple. Its diverse neighborhoods continue to thrive, reaping the benefits of additional tourist visitation to new hotel properties, including the Mandarin Oriental Hotel in the Time Warner complex, the Hotel Gansevoort in the meatpacking district, and The Alex on the east side of Midtown Manhattan, among others.
New York City is looking forward to welcoming delegates to the Republican National Convention this summer. This particular event will reaffirm to the international community that the city is the most exciting destination for business and recreational travel in the world.
A review of the previous tables reveals the following.
- The boutique segment registered the strongest growth in supply from
1998 through 2003, increasing at an average annual compounded rate
of roundly 10.0%. All remaining segments exhibited similar supply
increases ranging from 2.0% to 3.0%.
- Despite significant increases in supply, the boutique segment was
the only category to show a positive average annual compounded growth
both in terms of occupancy and RevPAR, during the historical period
reviewed.
- The boutique segment has shown stronger and earlier signs of recovery
than the other segments, as evidenced by the positive RevPAR growths
in 2002 and 2003.
Operating Statistics by Neighborhood
The following tables compare the performance of all reporting hotels
in Manhattan from 1998 through 2003; results are broken down by neighborhood,
including Midtown West, Midtown East, and Downtown.
Midtown West
| Year |
Supply |
% Change |
Demand |
% Change |
Occupancy |
% Change |
ADR |
% Change |
RevPAR |
% Change |
|
1998
|
8,865,997
|
---
|
7,453,036
|
---
|
84.1 %
|
---
|
$193.88
|
---
|
$162.98
|
---
|
|
1999
|
9,258,796
|
4.4 %
|
7,634,743
|
2.4 %
|
82.5
|
(1.9) %
|
202.18
|
4.3 %
|
166.72
|
2.3 %
|
|
2000
|
9,500,500
|
2.6
|
8,070,815
|
5.7
|
85.0
|
3.0
|
214.37
|
6.0
|
182.11
|
9.2
|
|
2001
|
9,970,517
|
4.9
|
7,671,667
|
(4.9)
|
76.9
|
(9.4)
|
189.39
|
(11.7)
|
145.72
|
(20.0)
|
|
2002
|
10,367,336
|
4.0
|
7,894,500
|
2.9
|
76.1
|
(1.0)
|
182.98
|
(3.4)
|
139.34
|
(4.4)
|
|
2003
|
10,625,712
|
2.5
|
8,146,176
|
3.2
|
76.7
|
0.7
|
180.39
|
(1.4)
|
138.30
|
(0.7)
|
| Average Annual Compounded Change: |
3.7 %
|
|
1.8 %
|
|
(1.8) %
|
|
(1.4) %
|
|
(3.2) %
|
|
Source: Smith Travel Research
|
|
*Some figures may be subject to small rounding
errors
** Statistics based on selected hotels from a large database
|
Midtown East
| Year |
Supply |
% Change |
Demand |
% Change |
Occupancy |
% Change |
ADR |
% Change |
RevPAR |
% Change |
|
|
|
|
|
|
|
1998
|
6,471,318
|
---
|
5,123,812
|
---
|
79.2 %
|
---
|
$232.01
|
---
|
$183.70
|
---
|
|
1999
|
6,579,220
|
1.7 %
|
5,184,025
|
1.2 %
|
78.8
|
(0.5) %
|
243.79
|
5.1
|
192.09
|
4.6 %
|
|
2000
|
6,591,001
|
0.2
|
5,434,133
|
4.8
|
82.4
|
4.6
|
262.67
|
7.7
|
216.57
|
12.7
|
|
2001
|
6,677,302
|
1.3
|
4,759,384
|
(12.4)
|
71.3
|
(13.5)
|
231.09
|
(12.0)
|
164.71
|
(23.9)
|
|
2002
|
6,694,830
|
0.3
|
4,963,011
|
4.3
|
74.1
|
4.0
|
215.75
|
(6.6)
|
159.94
|
(2.9)
|
|
2003
|
6,657,765
|
(0.6)
|
4,999,089
|
0.7
|
75.1
|
1.3
|
206.91
|
(4.1)
|
155.36
|
(2.9)
|
| Average Annual Compounded Change: |
0.6 %
|
|
(0.5) %
|
|
(1.1) %
|
|
(2.3) %
|
|
(3.3) %
|
|
Source: Smith Travel Research
|
|
*Some figures may be subject to small rounding
errors
** Statistics based on selected hotels from a large database
|
Downtown
| Year |
Supply |
% Change |
Demand |
% Change |
Occupancy |
% Change |
ADR |
% Change |
RevPAR |
% Change |
|
1998
|
655,905
|
---
|
568,124
|
---
|
86.6 %
|
---
|
$221.34
|
---
|
$191.72
|
---
|
|
1999
|
685,761
|
4.6 %
|
595,563
|
4.8 %
|
86.8
|
0.3 %
|
241.74
|
9.2 %
|
209.94
|
9.5 %
|
|
2000
|
924,122
|
34.8
|
756,427
|
27.0
|
81.9
|
(5.7)
|
268.05
|
10.9
|
219.41
|
4.5
|
|
2001
|
916,095
|
(0.9)
|
693,461
|
(8.3)
|
75.7
|
(7.5)
|
241.47
|
(9.9)
|
182.79
|
(16.7)
|
|
2002
|
965,710
|
5.4
|
733,537
|
5.8
|
76.0
|
0.3
|
229.58
|
(4.9)
|
174.39
|
(4.6)
|
|
2003
|
1,181,727
|
22.4
|
884,804
|
20.6
|
74.9
|
(1.4)
|
226.53
|
(1.3)
|
169.61
|
(2.7)
|
| Average Annual Compounded Change: |
12.5 %
|
|
9.3 %
|
|
(2.9) %
|
|
1.2 %
|
|
(5.9) %
|
|
Source: Smith Travel Research
|
|
*Some figures may be subject to small rounding
errors
** Statistics based on selected hotels from a large database
|
Lalia Rach
Ed.D, Associate Dean,
The
Preston Robert Tisch Center for Hospitality, Tourism, and Sports Management
After three years of negative forecasts and shrinking profits, the proverbial light at the end of the tunnel is rapidly expanding. There is a palatable sense of promise permeating the NYC hotel industry. The increase in demand is reflected in rising occupancies and rates. Consumers will expect improved service and fresh products. As the recovery gains momentum, the question remains: Will the industry successfully respond to consumer demands?
Overall, all three neighborhoods exhibited somewhat similar
trends from 1998 through 2002. However, data for 2003 indicate that the
Midtown West area has shown stronger and earlier signs of recovery; its
RevPAR remained fairly stable from 2002 to 2003, while that of the other
neighborhoods declined by roundly 3.0%. This superior performance can
be attributed to the existence of a strong commercial base coupled with
numerous leisure attractions.
Survey of Members of the Hotel Association of New York
City
An online survey of members of the Hotel Association
of New York City was conducted by the graduate students of New York University’s
Preston Robert Tisch Center for Hospitality, Tourism, and Sports Management.
The purpose of the survey was to gain perspective relative to the hotel
market in New York City. A summary of the findings is as follows.
Cristyne L. Nicholas
President & CEO,
NYC &
Company
At NYC & Company, we are optimistic about the city’s $21 billion
tourism industry which generates nearly $3 billion in city, state, and
federal taxes and supports more than 226,000 jobs throughout all five
boroughs. Recent indicators suggest that this will be the strongest spring
travel season since 2001. Hotel occupancy for the first quarter of 2004
was nearly 75%, compared to 66% for the same period in 2003.
Overall year-end 2003 figures have yet to be released, but the latest
projections reflect an increase of 1.2 million visitors from 2002, up
3.5% to 36.5 million, a record number of visitors to New York City.
The travel outlook for the domestic visitor market is set to break records
as well, with an estimated 31.7 million visitors in 2003 outpacing the
smaller but more lucrative international market which lagged overall
in 2003 but showed a surge in strength at the end of 2003 and into early
2004.
Major hotel development continues, with notable examples including
the recently opened Hotel Gansevoort, the Four Points by Sheraton Manhattan
Chelsea, the Mandarin Oriental Hotel, and The Alex. More than 1,400
new rooms joined New York City's hotel inventory in 2003 and nearly
1,300 additional rooms are under construction, reflecting the continued
confidence of the hospitality industry in New York City's tourism product.
Planned infrastructure investments in the rapidly growing cruise industry,
an expanded convention center, and proposed transportation projects,
as well as an architectural renaissance, will strengthen New York City’s
future as the premier visitor destination for conventions, business,
domestic, and international travel.
- Sixty-eight percent of the respondents said that terrorist attacks
in the U.S. are the single biggest threat to a sustained lodging industry
recovery, while 26% said the economy is the biggest threat. The current
situation in the Middle East was recorded by only 6% of the respondents
as the biggest threat to recovery.
- Fifty-eight percent did not think increased terrorist
attacks around the world in the recent months posed a threat to travelers
coming to New York City.
- All of the respondents predict year-end 2004 occupancy
levels will be higher than year-end 2003, at an average of 6.5%.
- Ninety-three percent forecast that year-end 2004 average rates
will be higher than 2003, $7.50 higher than the previous year.
- All respondents thought RevPAR for year-end 2004 would be higher
than year-end 2003, at an average of $11.25.
- Asked when they thought the Manhattan market would again reach historical
2000 occupancy levels, 14% said by 2005, 45% by 2006,
11% by 2007, and 31% said by 2008.
- Asked when they predicted the Manhattan market would again reach
year-end 2000 ADR levels, 3% said by 2005, 21% by 2006,
41% by 2007, and 34% said by 2008.
- When asked how their traveler profile (international vs. domestic)
has changed, 35% of the responses indicated fewer international travelers
while 29% indicated more domestic travelers.
- As the Euro is currently stronger than the U.S. dollar, only half
(53%) of the respondents stated they had seen an increase in European
travelers at their respective properties with the UK, Germany and
Italy being the most mentioned countries with increased travelers.
- Eighty-seven percent of those surveyed stated that Europe was the
strongest generator of international travelers to their respective
hotels.
- When asked whether their participation with Internet distributors
that sell portions of their room inventory had been positive or negative
to their bottom line, 63% said it had been positive mainly because
of increased occupancy. A majority of the remaining 37% stated that
Internet sales had lowered their ADRs.
- When asked the level of participation in third-party websites in
2004 compared with 2003, 48% said it would decrease, 28% said it would
increase, and 24% said it would not change. An average of about 15%
of respondent business is booked through third-party websites.
- Sixty-seven percent of those surveyed stated they thought the Manhattan
recovery began during the second half of 2003, while 17% think it
will begin in 2004, and 13% believe real recovery has not yet occurred.
- When asked what will have the greatest influence on the pace of
the recovery, 38% of the responses indicated revival of corporate
travel, 28% mentioned fear of terrorism, while 20% indicated the rate
of job growth.
- Fifty-nine percent thought an increase in rooms demand would be
the prime indicator of recovery in Manhattan hotels; 41% thought the
indicator would be increased RevPAR.
- Ninety percent of the responses indicated a continuing of short
booking windows for both group and transient business travelers, as
well as leisure travelers.
- Upscale (36%) and Midscale with food and beverage (25%) were the
market segments respondents felt would show the quickest signs of
recovery.
- Finally, most respondents (97%) felt both business and leisure travel
will increase in 2004, compared to 2003. Fifty percent feel that business
travel will increase more than 10%, while 50% feel leisure travel
will increase less then 10%.
Overall, the respondents believed that occupancy, ADR,
and RevPAR are expected to be higher this year over last. Most believe
the Manhattan recovery started during the second half of 2003 and that
2004 will show increases in both business and leisure travel while booking
windows will remain relatively short. Most respondents (86%) predict that
they will have to wait until 2006 and beyond before occupancy will again
reach 2000 levels and 75% feel it will be 2007 or later before ADR again
reaches the year 2000 level. Views on third-party Internet bookings are
mixed, with just over 60% believing they have had a positive effect on
occupancy and a negative effect on rate; about half (48%) will decrease
third-party usage in 2004. Fear of terrorism and the economy are considered
the biggest (94% of the respondents) threats to sustained recovery. In
summary, the mood of the respondents can be characterized as cautious
optimism; 2004 will be better than 2003, the road to recovery is in sight,
and incremental growth is predicted.
Manhattan Operating History and Forecast
Michael R. Bloomberg
Mayor of the City of New
York
Tourism plays an integral role in New York City’s economic vitality.
Our outstanding cultural and social offerings, historic landmarks, and
amazing restaurants provide visitors with experiences they will never
forget. With the support of our thriving hospitality industry, we will
continue to develop and expand, offering people even more reasons to
visit the World’s Second Home.
As mentioned previously, the uncertainties of the war
in Iraq and the negative impact of the SARS epidemic on international
travel greatly hampered the Manhattan lodging market’s performance
in the first four months of 2003. However, market fundamentals started
improving in the second half of the year, and strong RevPAR increases
were attained in October through December of 2003. In view of these historical
trends, the expected year-over-year increases in the first four months
of 2004, the continued recovery of the regional and national economies,
a favorable exchange rate of the Euro against the U.S. dollar, and only
moderate supply growth, we project the marketwide RevPAR to increase by
7.8% in 2004, composed of a 3.6% growth in occupancy and a 4.0% rise in
average rate. As the national economy continues to recover, we project
that by 2006, Manhattan’s occupancy will reach close to 1999 levels
and average rate will return to 2000 levels.
Based on an analysis of the historical data and a review of proposed
hotels, we have prepared the following forecast for the Manhattan lodging
market.
| Year |
No. of Rooms |
�% Change |
� Occupied Rooms |
% Change |
Occupancy |
% Change |
� Average Rate |
Change |
� RevPAR� |
Change |
|
1987
|
51,785
|
---��
|
14,367,318
|
---��
|
76.0 %
|
---��
|
$114.66
|
---��
|
$87.15
|
---��
|
|
1988
|
51,870
|
0.2 %
|
14,403,588
|
0.3 %
|
76.1
|
0.1 %
|
121.67
|
6.1 %
|
92.56
|
6.2 %
|
|
1989
|
51,724
|
(0.3)
|
13,572,726
|
(5.8)
|
71.9
|
(5.5)
|
132.88
|
9.2
|
95.53
|
3.2
|
|
1990
|
53,348
|
3.1
|
13,853,761
|
2.1
|
71.1
|
(1.0)
|
131.54
|
(1.0)
|
93.59
|
(2.0)
|
|
1991
|
54,090
|
1.4
|
13,204,783
|
(4.7)
|
66.9
|
(6.0)
|
127.14
|
(3.3)
|
85.04
|
(9.1)
|
|
1992
|
55,477
|
2.6
|
13,603,539
|
3.0
|
67.2
|
0.4
|
126.19
|
(0.7)
|
84.78
|
(0.3)
|
|
1993
|
55,426
|
(0.1)
|
14,137,222
|
3.9
|
69.9
|
4.0
|
127.86
|
1.3
|
89.35
|
5.4
|
|
1994
|
55,794
|
0.7
|
15,156,219
|
7.2
|
74.4
|
6.5
|
135.06
|
5.6
|
100.52
|
12.5
|
|
1995
|
56,292
|
0.9
|
15,798,383
|
4.2
|
76.9
|
3.3
|
146.96
|
8.8
|
113.00
|
12.4
|
|
1996
|
56,534
|
0.4
|
16,666,418
|
5.5
|
80.8
|
5.0
|
161.53
|
9.9
|
130.47
|
15.5
|
|
1997
|
57,406
|
1.5
|
17,094,812
|
2.6
|
81.6
|
1.0
|
178.20
|
10.3
|
145.38
|
11.4
|
|
1998
|
58,016
|
1.1
|
17,438,157
|
2.0
|
82.3
|
0.9
|
199.49
|
11.9
|
164.28
|
13.0
|
|
1999
|
59,608
|
2.7
|
17,657,134
|
1.3
|
81.2
|
(1.4)
|
209.52
|
5.0
|
170.04
|
3.5
|
|
2000
|
61,115
|
2.5
|
18,671,091
|
5.7
|
83.7
|
3.1
|
223.75
|
6.8
|
187.28
|
10.1
|
|
2001
|
62,859
|
2.9
|
17,089,561
|
(8.5)
|
74.5
|
(11.0)
|
196.76
|
(12.1)
|
146.56
|
(21.7)
|
|
2002
|
63,501
|
1.0
|
17,354,297
|
1.5
|
74.9
|
0.5
|
186.89
|
(5.0)
|
139.93
|
(4.5)
|
|
2003
|
64,674
|
1.8
|
17,846,423
|
2.8
|
75.6
|
1.0
|
182.53
|
(4.0)
|
138.00
|
(1.4)
|
| Forecast |
|
|
|
|
|
|
|
|
|
|
2004
|
65,219
|
0.8 %
|
18,649,512
|
4.5 %
|
78.3 %
|
3.6 %
|
$189.83
|
4.0 %
|
$148.72
|
7.8 %
|
|
2005
|
66,327
|
1.7
|
19,395,493
|
4.0
|
80.1
|
2.3
|
206.92
|
9.0
|
165.77
|
11.5
|
|
2006
|
66,592
|
0.4
|
19,783,402
|
2.0
|
81.4
|
1.6
|
223.47
|
8.0
|
181.89
|
9.7
|
|
Sources: Smith Travel Research/HVS International
* Some figures may be subject to small rounding errors
|
Overview of Sales Transactions in Manhattan
The table on the following pages sets forth an overview of Manhattan
hotel sales from 1992 through April of 2004.
| Property |
Date of Sale |
Address |
No. of Rooms
|
Seller |
Buyer |
Price����������
|
Price per Room
|
| InterContinental Central Park South * |
Apr-04 |
112 Central Park S. |
211
|
InterContinental Hotels Group |
Anbau Enterprises |
$63,500,000
|
$300,948
|
| The Shoreham * |
Jan-04 |
33 West 55th Street |
177
|
Credit Suisse First Boston |
An affiliate of Ark Investment Partners LP |
$14,500,000
|
$81,921
|
| Helmsley Hotel Windsor |
Sep-03 |
100 West 58th Street |
244
|
Leona Helmsley |
Joseph and Jack Chetrit |
$55,000,000
|
$225,410
|
| Gorham Hotel |
Sep-03 |
136 West 55th Street |
117
|
Private Investors |
Richard Born and Ira Krukier |
$23,100,000
|
$197,436
|
| Roger Williams * |
Sep-03 |
131 Madison Avenue |
187
|
PTG Madison 31 Trust |
JRK New York Hotel Partners |
$26,500,000
|
$141,711
|
| Loews Metropolitan |
Jul-03 |
Lexington Ave at 51st St. |
722
|
Loews Hotels |
Whitehall Street Real Estate Fund |
$110,250,000
|
$152,701
|
| |
|
|
|
(as renovated assuming a $20 million infusion) |
|
$130,250,000
|
$180,402
|
| Doral Park Avenue (now Kimpton Hotel) |
Jul-03 |
70 Park Avenue |
188
|
Hayman Company |
Kennedy Associates |
$38,240,000
|
$203,404
|
| |
|
|
205
|
(as renovated and expanded assuming a $19-million infusion) |
|
$57,240,000
|
$279,220
|
| Hotel Wales |
Nov-02 |
1295 Madison Ave. |
87
|
PTG Wales Trust |
DLJ Real Estate Capital Partners II LP |
$24,000,000
|
$275,862
|
| Fitzpatrick Hotel |
Aug-02 |
127 East 55th Street |
130
|
British Airways |
Hotel Properties Ltd, Singapore |
$30,690,000
|
$236,077
|
| Algonquin Hotel |
Jun-02 |
59 West 44th St. |
174
|
Camberley Hotel Co./Olympus RE |
Miller Global Properties |
$41,400,000
|
$237,931
|
| Delmonico Hotel |
Nov-01 |
502 Park Avenue |
152
|
N/A |
Donald Trump |
$115,000,000
|
$756,579
|
| The Barbizon |
May-01 |
140E 63rd St. |
300
|
Ian Schrager Hotels |
Berwind Property Group |
$96,000,000
|
$320,000
|
| Rihga Royal * |
Feb-01 |
151 W 54th St. |
500
|
Royal Hotels Ltd. |
Thayer Lodging Group, Inc. |
$193,000,000
|
$386,000
|
| The Carlyle |
Jan-01 |
35 E 76th St� |
194
|
Mr. Norman Peck (et al) |
Maritz Wolff & Co |
$127,500,000
|
$657,216
|
| Downtown Athletic Club Hotel |
Oct-00 |
19 West St. |
116
|
CBA Real Estate Partners 19 West Hotel (LLC) |
Upper West St LLC |
$20,000,000
|
$172,414
|
| The Sutton |
Jun-00 |
330 East 56th St. |
84
|
Hong Kong & Shanghai Hotels |
Glenwood Management |
$35,000,000
|
$416,667
|
| Westpark Hotel |
May-00 |
308 W 58th St. |
99
|
The Leo Rosner Foundation, Inc. |
Berit Reality |
$11,500,000
|
$116,162
|
| Sofitel New York |
Mar-00 |
45 W 44th St. |
398
|
Accor North America Corporation |
Finova Capital, Pitney Bowes |
$77,177,000
|
$193,912
|
| Fulton Plaza Apartment Hotel |
Jan-00 |
106-108 Fulton St. |
85
|
Fulton/Max International |
Pace University |
$20,000,000
|
$235,294
|
| Days Inn Midtown Manhattan |
Dec-99 |
790 8th Avenue |
368
|
Loews Corp. |
Hampshire Hotels & Resorts, LLC |
$53,877,844
|
$146,407
|
| Howard Johnson Plaza |
Dec-99 |
851 8th Avenue |
300
|
Loews Corp. |
Hampshire Hotels & Resorts, LLC |
$43,922,156
|
$146,407
|
| The Stanhope Hotel * |
Dec-99 |
995 Fifth Avenue |
150
|
Colony Stanhope Partners |
Hyatt Partnership Interests |
$58,000,000
|
$386,667
|
| Hotel Lexington |
Sep-99 |
511-515 Lexington Ave. |
710
|
Lex Taj Corporation |
Highgate Hotels |
$105,000,000
|
$147,887
|
| |
|
|
|
(as renovated assuming a $13 million infusion) |
|
$118,000,000
|
$166,197
|
| Westin (now InterContinental) |
Jul-99 |
112 Central Park S. |
214
|
Starwood Hotels & Resorts |
Bass Hotels International |
$62,500,000
|
$292,056
|
| Essex House |
Mar-99 |
160 Central Park S. |
597
|
Essex Associates |
Strategic Hotel Capital |
$260,000,000
|
$435,511
|
| Four Seasons Hotel * |
Feb-99 |
West 57th St. |
370
|
A Hong Kong Consortium (50.1%), Lai Sun Hotels (49.9%) |
57 BB Property, LLC |
$275,000,000
|
$743,243
|
| Doral Park Avenue |
Jan-99 |
49th St. & Lexington |
188
|
John Hancock Mutual Life |
Hayman Company |
$43,000,000
|
$228,723
|
| Swissotel New York |
Dec-98 |
56th St. & Madison |
495
|
Blackstone Group |
Host Marriott |
$179,123,000
|
$361,865
|
| Five Gotham Hotels ** |
Jul-98 |
Manhattan |
531
|
Gotham Hospitality Group |
CS First Boston |
$132,000,000
|
$248,588
|
| Radisson Empire & Barbizon |
May-98 |
Manhattan |
675
|
Affiliates of Metro Media Corp. |
Ian Schrager Hotels and NorthStar |
$169,000,000
|
$250,370
|
| St. Moritz on Central Park * |
May-98 |
50 Central Park S. |
681
|
FAI Insurance Limited |
Ian Schrager Hotels and NorthStar |
$87,000,000
|
$127,753
|
| |
|
|
|
(price adjusted to reflect a $93,000,000 renovation) |
|
$180,000,000
|
$264,317
|
| Marriott East Side |
Feb-98 |
525 Lexington Ave. |
643
|
Marriott Corporation |
Strategic Hotel Capital |
$191,300,000
|
$297,512
|
| Luxury Collection Hotel New York |
Jan-98 |
112 Central Park S. |
214
|
Sheik Abdul Aziz bin Ibrahim al-Ibrahim |
Starwood Lodging |
�$ 78,030,606
|
$364,629
|
| Hotel Beverly |
Nov-97 |
125 E. 50th St. |
188
|
Highgate Corporation |
Manhattan East Suite Hotels |
$41,000,000
|
$218,085
|
| Hotel Pennsylvania |
Aug-97 |
401 Seventh Ave. |
1,705
|
Ascot Associates & 15 Penn Plaza |
Leisure Venture Holdings, Ltd. |
$160,000,000
|
$93,842
|
| UN Plaza Hotel |
Jun-97 |
First Ave. & 44th St. |
427
|
United Nations Development Corp. |
Regal Hotels International |
$102,000,000
|
$238,876
|
| Quality Inn - Fifth Avenue * |
May-97 |
11 E. 40th St. |
186
|
Journey's End Corporation |
Westmont Hotels |
$24,000,000
|
$129,032
|
| |
|
|
|
(price adjusted to fee simple equivalent) |
|
$33,412,000
|
$179,634
|
| Plaza Ath�n�e |
Apr-97 |
37 E. 64th St. |
153
|
Forte Hotels PLC |
Plaza Ath�n�e Hotel Corp., Ltd. |
$68,800,000
|
$449,673
|
| Algonquin Hotel |
Mar-97 |
59 W. 44th St. |
165
|
Caesar Park Hotels |
Camberley Hotel Co./Olympus RE |
$30,000,000
|
$181,818
|
| Consulate Hotel * |
Nov-96 |
224 W. 49th St. |
200
|
B.S.D. & J., Inc. |
Consulate Hotel Associates, LLC |
$13,000,000
|
$65,000
|
| |
|
|
|
(price adjusted to fee simple equivalent) |
|
$21,143,000
|
$105,715
|
| Marriott Financial Center |
Dec-96 |
85 West St. |
504
|
Swiss Bank |
Host Marriott |
$101,000,000
|
$200,397
|
| Doral Tuscany/Doral Court |
Sep-96 |
120 & 130 E. 39th St. |
121/199
|
Carol Management Corp. |
Starwood Lodging |
$42,000,000
|
$131,250
|
| Mayfair Hotel |
Aug-96 |
610 Park Avenue |
201
|
Teachers Insurance |
Colony Capital |
$61,000,000
|
$303,483
|
| Four Seasons Hotel * |
Aug-96 |
57 E. 57th St. |
367
|
Hotel Investment Group |
Hotel 57, led by Lai Sun Group |
$195,000,000
|
$531,335
|
| |
|
|
|
(price adjusted to fee simple equivalent) |
|
$239,000,000
|
$651,226
|
| Dorset Hotel |
Feb-96 |
30 W. 54th St. |
319
|
Unknown |
Museum of Modern Art |
$50,000,000
|
$156,740
|
| Vista International * |
Dec-95 |
3 World Trade Center |
820
|
Port Authority of NY & NJ |
Host Marriott |
$141,500,000
|
$172,561
|
| |
|
|
|
(price adjusted to fee simple equivalent) |
|
$153,000,000
|
$186,585
|
| Doral Inn� (now The W Hotel) |
Sep-95 |
555 Lexington Ave. |
652
|
Carol Management Corp. |
Starwood Lodging |
$71,000,000
|
$108,896
|
| Park Central Hotel |
Sep-95 |
870 Seventh Ave. |
1,270
|
Park Centre Associates |
H. Park Central LLC, et al. |
$60,000,000
|
$47,244
|
| The Plaza |
Aug-95 |
768 Fifth Avenue |
808
|
Plaza Operating Partners |
CDL Hotels/Prince Alwaleed |
$325,000,000
|
$402,228
|
| Hotel Macklowe/Millennium |
Dec-94 |
145 W. 44th St. |
629
|
Chemical Bank |
CDL Hotels International |
$97,500,000
|
$155,008
|
| Barbizon Hotel |
Nov-94 |
140 E. 63rd St. |
345
|
Bank of Tokyo, et. al. |
Metromedia Company� |
$31,500,000
|
$91,304
|
| Marriott East Side |
Oct-94 |
525 Lexington Ave. |
664
|
Mitsubishi Trust and Banking |
Morris Bailey and Host Marriott |
$55,000,000
|
$82,831
|
| Morgans Hotel |
Aug-94 |
237 Madison Ave. |
113
|
237 Holding Corp./Bank of Tokyo |
Morgans Hotel Group |
$12,000,000
|
$106,195
|
| Hotel Millenium |
Jun-94 |
Fulton at Church St. |
561
|
Kalikow Fulton Church Realty |
CDL Hotels International |
$75,000,000
|
$133,690
|
| The Palace * |
Oct-93 |
Madison Avenue |
965
|
Helmsley Hotels |
Amadeo Hotels (Brunei)� |
$202,000,000
|
$209,326
|
| Parc 51/Michelangelo |
Jun-92 |
152 W. 51st St. |
178
|
Park Lane Hotels |
Starhotels |
$38,900,000
|
$218,539
|
| Omni Berkshire |
Mar-92 |
22 E. 52nd St. |
420
|
Aer Lingus |
Wharf Holding, Ltd. |
$83,500,000
|
$198,810
|
| Dover Hotel/Fitzpatrick Hotel |
Jul-91 |
Lexington Ave. |
92
|
Japonica Partners |
Fitzpatrick Hotel Group |
$16,500,000
|
$179,348
|
| Flatotel (all-suite) |
May-91 |
135 W. 52nd St. |
208
|
Carteret Savings Bank |
Euro American Lodging Corp. |
$51,000,000
|
$245,192
|
| Madison Towers |
Feb-91 |
22 E. 38th St. |
326
|
Cafcor Trust |
Jolly Hotels USA |
$61,500,000
|
$188,650
|
| Sheraton Centre & City Squire * |
Sep-90 |
Seventh Ave. |
2,402
|
Equitable Life Insurance |
Sheraton |
$194,206,715
|
$80,852
|
| Rihga Royal Hotel * |
May-90 |
151 W. 54th St. |
505
|
Hiro Saito |
Rihga International� |
$212,795,000
|
$421,376
|
| Viscount Hotel |
Feb-90 |
127-29 E. 55th St. |
177
|
Trusthouse Forte |
British Airways |
$21,784,000
|
$123,073
|
| St. Moritz * |
Jan-90 |
106 Central Park S. |
679
|
FAI Insurance, Inc. |
Bond Corp Holdings, Ltd. |
$174,914,000
|
$257,605
|
| Grand Bay Hotel/Parc 51 |
Aug-89 |
152 W. 51st St. |
178
|
Morris Bailey |
Park Lane Hotels |
$74,500,000
|
$418,539
|
| Royal Concordia |
Apr-89 |
151 W. 54th St. |
505
|
SARA Hotels/Zeckendorf |
Royal Hotels |
$240,000,000
|
$475,248
|
| Stanhope Hotel * |
Nov-88 |
995 Fifth Ave. |
132
|
Unknown |
Tobishima Associates |
$175,000,000
|
$1,325,758
|
| St. Regis * |
Nov-88 |
715-19 Fifth Ave. |
380
|
Equitable |
Sheraton� |
$130,000,000
|
$342,105
|
| Plaza Hotel |
Sep-88 |
768 Fifth Ave. |
808
|
Aoki/Bass |
Trump Organization |
$390,000,000
|
$482,673
|
| Maxim's de Paris/Peninsula Hotel |
Sep-88 |
700 Fifth Ave. |
254
|
Various (partnership) |
The Peninsula Group |
$127,000,000
|
$500,000
|
| Empire Hotel |
Sep-88 |
1889-95 Broadway |
500
|
Arnold Wadler, King Hotels |
Empire Hotel Center Associates |
$58,750,000
|
$117,500
|
| Barbizon * |
Aug-88 |
140 E. 63rd St. |
368
|
KLM� (Royal Dutch Airlines) |
Pilevsky/Cohen |
$57,000,000
|
$154,891
|
| Grand Bay Hotel |
Jun-88 |
152 W. 51st St. |
178
|
Equitable Life Assurance |
Morris Bailey |
$51,000,000
|
$286,517
|
| Chatwal Inn * |
May-88 |
304 E. 42nd St. |
520
|
Steven Silverberg |
Chatwal Hotels |
$47,800,000
|
$91,923
|
| Manhattan Viscount |
May-88 |
127-29 E. 55th St. |
177
|
Kennedy-Brooks |
Trusthouse Forte |
$16,880,000
|
$95,367
|
| St. Moritz * |
May-88 |
106 Central Park S. |
722
|
St. Moritz Hotel Assoc. |
Alan Bond |
$180,000,000
|
$249,307
|
| Westin Plaza Hotel |
Feb-88 |
785 Fifth Ave. |
812
|
NY Westin Hotel Co. |
Aoki & Robert M. Bass |
$35,000,000
|
$43,103
|
| Gotham/Maxim's * |
Jul-87 |
55th & Fifth Ave. |
254
|
Several Banks (German) |
Various (partnership) |
$70,000,000
|
$275,591
|
| Dorset Hotel |
May-87 |
26-40 West 54th St |
468
|
Robert D. Burch |
Sol Goldman |
$75,000,000
|
$160,256
|
| Esplanade Hotel |
Jan-87 |
301-11 West End Ave |
171
|
Irvco Holdings/Espl. Synd. |
Esplanade Hotel Assoc |
$16,750,000
|
$97,953
|
|
* known leasehold
and/or partial interest sold
** per
room price based on a per-room allocation of a package price
|
Joseph Spinnato
President & CEO
Hotel Association of New York City
New York City�s hotel industry has weathered the economic storm that started brewing during the first part of 2001 and fully engulfed the city from fall 2001 through the second half of 2003. First quarter 2004 results were positive and strong. Despite many challenges remaining ahead, the city�s hotel professionals are expressing optimism for a steady recovery and growth going forward.
The coming Republican National Convention will provide a boost to the city�s coffers and spirits. The industry is working closely with city officials to ensure a safe, secure, productive and enjoyable visit from the thousands of delegates who will descend upon New York City this August.
Simultaneously, we are finally seeing progress on the Javits Center Expansion with serious discussions of viable funding sources. HANYC members are willing to do their part in providing an additional hotel tax as a source of funding for the much needed expansion. Stipulations include the following: that the tax - currently proposed at $1.50 per key per occupied room - be reasonable, be dedicated solely to funding of the Javits Center expansion, be subject to a sunset clause; and that other members of the city�s travel and tourism industry contribute as well.
At press-time, hoteliers were putting the finishing touches on the rooms portion of the city�s 2012 Olympic bid in an effort to position New York City as positively as possible as the field narrows and the committee continues weighing its options.
On a daily basis, the industry�s collective goal is to provide business and leisure travelers with a world-class lodging experience while in New York City.
As a result of the previous recession in the early 1990s,
limited transactions occurred in 1992 and 1993, following by moderate
increases in sales activity in 1994 and 1995. The hotel industry in Manhattan
experienced significant sales transaction activity from 1996 through the
first half of 2000, due to the upswing in hotel operating profits as well
as the increased availability of debt financing. Hotel REITs and operating
companies were in a strong acquisition mode during this period, which,
coupled with the relatively low cost of debt and equity, helped to enhance
hotel values. The downturn in lodging REIT and C-Corp. stock prices, as
well as the uncertainty of the capital markets, contributed to a slowdown
in sales activity as of the second half of 2000.
Following the events of September 11, 2001, hotel transaction
activity further declined due to the uncertainty regarding hotel operating
performance and stricter underwriting by lenders. Well-capitalized owners
were generally holding onto their assets until market conditions normalized.
Those owners facing debt-service shortfalls modified loan payment terms
with their lenders or brought in new equity to the investment. Few owners
have been forced to sell their assets.
Since the end of 2001, numerous buyers have raised capital
to purchase hotels at levels below replacement cost. Declining hotel performance
in 2002, followed by the war in Iraq and the SARS epidemic in the first
half of 2003, caused many transactions to stall due to a gap between seller
and buyer expectations.
As of the last quarter of 2003, hotel investors now perceive
that the hotel industry in Manhattan has turned around, and occupancy
and rates are expected to rebound significantly over the next few years;
buyers are starting to meet seller expectations. We note that all five
sales that occurred in 2003 took place during the second half of the year,
as the Manhattan lodging market was starting to turn around.
Two hotels sold in the first four months of 2004 and
several hotels are anticipated to change ownership in 2004 and beyond.
We expect significant sales transaction activity in the next few years,
similar to the activity that followed the previous recession of the early
1990s.
We note that from 1992 through April 2004, the highest
per-room price was achieved by the Four Seasons, at roundly $743,000,
in February of 1999.
Five transactions were identified in 2003; the following
is a synopsis of each of these sales.
- The 244-room Helmsley Hotel Windsor was sold in September
2003, to be converted to luxury condominiums, for $55,000,000 or roundly
$225,000 per room.
- The 117-room Gorham Hotel was sold in September 2003
for $23,100,000 or roundly $197,000 per room. The hotel closed and is
undergoing an extensive renovation; upon completion of the project,
the hotel will be repositioned as a four-star property. The hotel is
anticipated to have a soft reopening in May 2004 and a grand opening
in September 2004.
- In September 2003, the 187-room Roger Williams sold
for $26,500,000 or roundly $142,000 per room. The hotel is subject to
a ground lease with the Madison Avenue Baptist Church with less than
40 years remaining.
- The 722-room Loews Metropolitan Hotel sold in July 2003
for $110,250,000 or roundly $153,000 per room. The hotel underwent a
$26-million renovation after the sale, which encompassed all guestrooms
and public spaces.
- Currently named the Kimpton Hotel, the former 188-room Doral
Park Avenue sold in July 2003 for $38,240,000 or roundly $203,000
per room. The hotel closed in November 2003 to undergo a $19-million
renovation, which includes a new restaurant and 17 additional guestrooms.
|