| |
Michael R. Bloomberg
Mayor of the City
of New York |
| |
| |
| |
Jonathan M. Tisch
Chairman & CEO, Loews Hotels
Chairman, NYC
& Company |
| |
| |
| |
Stephen Rushmore
President and Founder, HVS
International |
| |
| |
| |
Lalia Rach
Ed.D, Associate Dean, The
Preston Robert Tisch Center for Hospitality, Tourism, and Sports
Management |
| |
| |
| |
| Cristyne L. Nicholas President
& CEO, NYC
& Company |
| |
| |
| |
Mark Lomanno
President, Smith
Travel Research |
| |
| |
| |
Joseph Spinnato
President & CEO,
Hotel Association
of NYC |
| |
| |
| |
Thomas J. Travers
General Manager, Hotel Beacon
President, Hospitality
Sales & Marketing Association International Big Apple Chapter |
| |
|
|
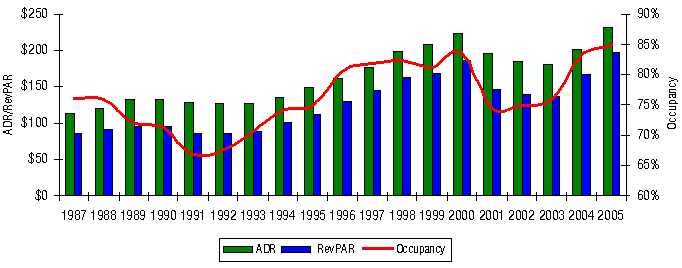
Manhattan Operating History
The following table illustrates aggregate occupancies and average
rates for contributing Manhattan hotels since 1987, as compiled
by Smith
Travel Research (STR). The table also summarizes marketwide
rooms revenue per available room (RevPAR); this figure, which
is calculated by multiplying occupancy by average rate, provides
an indication of how well rooms revenue is being maximized.
|
Year
|
No. of Rooms
|
% Change
|
Occupied Rooms
|
% Change
|
Occupancy
|
% Change
|
Average Rate
|
% Change
|
�RevPAR�
|
% Change
|
|
1987
|
52,683
|
��
|
14,624,039
|
��
|
76.1%
|
��
|
$113.05
|
��
|
$85.98
|
��
|
|
1988
|
52,768
|
0.2%
|
14,634,194
|
0.1%
|
76.0%
|
(0.1)%
|
$120.11
|
6.2%
|
$91.26
|
6.1%
|
|
1989
|
52,724
|
(0.1)%
|
13,873,898
|
(5.2)%
|
72.1%
|
(5.1)%
|
$132.09
|
10.0%
|
$95.23
|
4.3%
|
|
1990
|
54,421
|
3.2%
|
14,139,816
|
1.9%
|
71.2%
|
(1.3)%
|
$132.34
|
0.2%
|
$94.21
|
(1.1)%
|
|
1991
|
55,058
|
1.2%
|
13,442,624
|
(4.9)%
|
66.9%
|
(6.0)%
|
$127.54
|
(3.6)%
|
$85.31
|
(9.4)%
|
|
1992
|
56,235
|
2.1%
|
13,871,555
|
3.2%
|
67.6%
|
1.0%
|
$126.27
|
(1.0)%
|
$85.33
|
0.0%
|
|
1993
|
56,190
|
(0.1)%
|
14,494,889
|
4.5%
|
70.7%
|
4.6%
|
$126.33
|
0.1%
|
$89.28
|
4.6%
|
|
1994
|
56,083
|
(0.2)%
|
15,156,219
|
4.6%
|
74.0%
|
4.8%
|
$136.12
|
7.7%
|
$100.78
|
12.9%
|
|
1995
|
56,285
|
0.4%
|
15,410,904
|
1.7%
|
75.0%
|
1.3%
|
$149.33
|
9.7%
|
$112.02
|
11.2%
|
|
1996
|
56,552
|
0.5%
|
16,654,408
|
8.1%
|
80.7%
|
7.6%
|
$160.72
|
7.6%
|
$129.68
|
15.8%
|
|
1997
|
57,424
|
1.5%
|
17,158,942
|
3.0%
|
81.9%
|
1.5%
|
$176.86
|
10.0%
|
$144.79
|
11.7%
|
|
1998
|
57,943
|
0.9%
|
17,415,191
|
1.5%
|
82.3%
|
0.6%
|
$198.25
|
12.1%
|
$163.24
|
12.7%
|
|
1999
|
59,585
|
2.8%
|
17,634,111
|
1.3%
|
81.1%
|
(1.5)%
|
$208.44
|
5.1%
|
$169.01
|
3.5%
|
|
2000
|
61,053
|
2.5%
|
18,644,871
|
5.7%
|
83.7%
|
3.2%
|
$222.53
|
6.8%
|
$186.19
|
10.2%
|
|
2001
|
62,790
|
2.8%
|
17,065,999
|
(8.5)%
|
74.5%
|
(11.0)%
|
$195.65
|
(12.1)%
|
$145.69
|
(21.8)%
|
|
2002
|
63,320
|
0.8%
|
17,340,430
|
1.6%
|
75.0%
|
0.8%
|
$185.88
|
(5.0)%
|
$139.47
|
(4.3)%
|
|
2003
|
64,470
|
1.8%
|
17,852,440
|
3.0%
|
75.9%
|
1.1%
|
$181.24
|
(2.5)%
|
$137.50
|
(1.4)%
|
|
2004
|
64,077
|
(0.6)%
|
19,445,724
|
8.9%
|
83.1%
|
9.6%
|
$201.36
|
11.1%
|
$167.42
|
21.8%
|
|
2005
|
63,101
|
(1.5)%
|
19,580,575
|
0.7%
|
85.0%
|
2.2%
|
$232.31
|
15.4%
|
$197.46
|
17.9%
|
| Average Annual Compounded Change |
| 1987-2005: |
�1.0
|
|
1.6%
|
|
0.6%
|
|
4.1%
|
|
4.7%
|
Source: Smith Travel Research
Note: Some figures may be subject to small rounding errors
Thomas J.
Travers
General Manager, Hotel Beacon
President, Hospitality
Sales & Marketing Association International Big Apple Chapter
Competition for travelers continues to intensify among world-class
destinations with NYC at the top of that list. While the Big Apple
has always caused some sticker shock to certain groups, the NYC
visitor experience remains persuasive, as our product mix and
quality constantly improves. The challenge continues to be managing
our guests' ever-increasing expectations in the midst of escalating
costs pressuring both profits and service.
The Manhattan hotel market has experienced dramatic cycles since
the late 1980s. A significant downturn occurred in the early 1990s,
reflecting the combined impact of supply additions, the nationwide
recession, several disappointing years in the financial markets,
and the Persian Gulf War; the result was a substantial decline
in both occupancy and RevPAR. Signs of true recovery began to
appear in 1993, and by the end of 1994, it was clear that a dramatic
improvement in the market was underway. With the exception of
1999, which saw a substantial increase in supply, overall RevPAR
registered double-digit growth each year from 1994 through 2000.
A second significant downturn started in 2001, as a result of
the slowdown in the national and regional economies, as well as
the September 11 terrorist attacks; the result was even more dramatic
than that of the previous recession, with a RevPAR decline of
21.7%. In 2002, marketwide occupancy rose slightly, as many hotels
in the market employed a strategy of aggressive rate discounts
to stimulate demand and maintain occupancy levels; marketwide
average rate decreased further, resulting in a RevPAR decline
of 4.3% compared to 2001. Despite a RevPAR decline of 1.4%, composed
of a 1.1% growth in occupancy and a 2.5% decline in average rate,
2003 ended on a very positive note for the Manhattan lodging market.
In 2004, for the first time since 1994, supply declined in Manhattan
as a result of the closing of several hotels for condominium conversion.
This trend continued in 2005, recording another 1.5% decline in
supply. The continued compression in the market caused occupancy
to increase further, by 2.0% in 2005, and enabled hotel operators
to aggressively increase average rates, resulting in an overall
gain of 15.4%.
The following table sets forth monthly changes in occupancy,
average rate, and RevPAR for 2004 and 2005.
|
Occupancy
|
Average Rate
|
RevPAR
|
| Month |
2004
|
2005
|
2004
|
2005
|
2004
|
2005
|
| January |
11.1%
|
6.4%
|
(0.5)%
|
7.4%
|
10.6%
|
14.3%
|
| February |
8.2%
|
8.6%
|
0.3%
|
10.7%
|
8.5%
|
20.3%
|
| March |
23.9%
|
3.7%
|
7.6%
|
11.3%
|
33.3%
|
15.4%
|
| April |
28.5%
|
1.5%
|
9.5%
|
16.2%
|
40.7%
|
18.0%
|
| May |
13.7%
|
2.5%
|
14.3%
|
13.0%
|
29.9%
|
15.8%
|
| June |
8.7%
|
0.9%
|
14.7%
|
17.0%
|
24.7%
|
18.0%
|
| July |
9.2%
|
3.8%
|
12.3%
|
13.5%
|
22.6%
|
17.9%
|
| August |
2.0%
|
4.0%
|
15.4%
|
11.7%
|
17.7%
|
16.2%
|
| September |
7.0%
|
2.4%
|
14.1%
|
24.8%
|
22.0%
|
27.8%
|
| October |
3.0%
|
(1.8)%
|
13.4%
|
18.3%
|
16.9%
|
16.2%
|
| November |
3.2%
|
0.7%
|
14.9%
|
20.5%
|
18.6%
|
21.4%
|
| December |
3.5%
|
(2.9)%
|
15.0%
|
18.3%
|
18.9%
|
14.9%
|
| Total |
9.6%
|
2.3%
|
11.1%
|
15.4%
|
21.8%
|
18.0%
|
Source: Smith Travel Research
Demand levels in Manhattan increased strongly in 2004, especially
during the first half of the year, with overall occupancy increasing
from roundly 2.0% to 28.5% each month through the end of the year.
The year 2005 started registering strong growth during the first
three months, growing at a more modest pace the rest of the year.
With demand compression increasing, average rate showed double-digit
growth from May 2004 through December 2005, with the exception
of January 2005. As a result of continued occupancy and especially
average rate growth, overall RevPAR registered significant increases
during all months of the year, rising at rates of roundly 18.0%
on average.
The combination of a still growing and very optimistic economic
climate in 2005, and the market's strong performance during the
entire year, resulted in another strong 18.0% RevPAR increase
in 2005, compared to 2004. Monthly statistics indicate that year-over-year
RevPAR increases accelerated from roughly 14.3% in January to
27.8% in September, then decelerated again to roundly 14.9% in
December. The strong RevPAR growth in 2005 was generated primarily
by the significant increases in average rate during every month
of the year, suggesting that the continued demand compression
in the market enabled hoteliers to achieve robust year-over-year
room rate increases.
The following chart illustrates the Manhattan lodging market's
performance from 1987 through 2005.
<<Previous Next
>>
|
|