
 While the impacts of the COVID-19 pandemic on the lodging industry are ongoing, this tenth annual HVS Lodging Tax Study quantifies the revenue impact of the pandemic over the past year. An analysis of 25 major US markets shows losses totaling approximately $1.3 billion in 2020 from historical levels in 2019. HVS forecasts a loss of $1.45 billion in rooms revenue in 2021 from a baseline scenario with no pandemic. HVS also provides historical data on tax rates and the collection and distribution of revenue from lodging taxes levied in all 50 States and the 150 largest US cities.
Introduction
Lodging taxes provide a critical source of support for the convention and tourism industries. Lodging tax revenues fund debt service for the construction of convention centers, arenas, and other public assembly facilities. This revenue source provides a large share of the funding for destination marketing organizations (“DMOs”) and covers the operating deficits of convention center venues. Beginning in March 2020, the United States hospitality industry faced unprecedent challenges and losses resulting from the COVID-19 pandemic. The lack of convention business, leisure, and business travel across the country during the early days of the pandemic severely reduced lodging tax revenue streams.Despite the rapid deployment of a readily available vaccine, vaccine hesitancy and more virulent strains of the SARS-CoV-2 coronavirus have created more uncertainty about the pace of economic recovery of the hospitality industry. This report provides insight into how the COVID-19 pandemic reduced lodging tax revenues by analyzing available historical data on lodging tax collections. Using one year of historical data, HVS quantified the impact of the virus and projected the extent of ongoing the economic fallout from the pandemic, which may last for years. Future editions of the HVS Lodging Tax Study will track how the situation evolves.
COVID-19 Impact on the Lodging Industry
The hospitality and tourism industries have proven to be the most vulnerable industries to the COVID-19 pandemic with percentages of revenue losses far exceeding that of the overall economy. As of January 2021, U.S. Travel Association and Tourism Economics reported approximately $500 billion in losses and $64 billion in lost federal, state, and local taxes by the end of 2020[1].
The hospitality industry relied on direct relief offered throughout the COVID-19 pandemic, including the March 2020 $2.0-trillion CARES economic-aid package, the December 2020 $900-million aid package, and the March 2021 $1.9-trillion American Rescue Plan. The $3.5 trillion budget resolution currently working its way through the congressional approval process promises additional economic stimulus. Full recovery from the initial shock of the COVID-19 pandemic, according to the American Hotel & Lodging Association is not expected until 2024, with state and local tax revenues generated by hotels recovering earlier, albeit in 2023.[2]
Lodging Tax Loss Forecast
HVS combined data on lodging tax collections with projections of the performance of hotel markets in 25 major US cities. Before the onset of the crisis, during fiscal year 2019, 25 major US markets generated approximately $3.7 billion in lodging tax revenue as shown in the figure below. In total, these markets experienced a -34.66% decline in revenues from 2019 to 2020.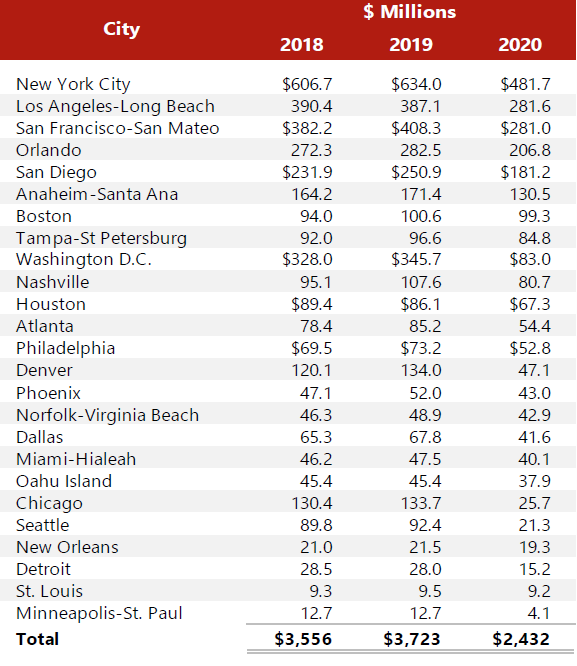
Given the uncertainty surrounding the pandemic throughout 2020, economists and analysts relied on the shape and magnitude of prior economic shocks to estimate losses resulting from COVID-19. These estimates varied from the less-severe (V-shaped recessions similar to the recessions of the 1990s and early 2000s) to the more-severe (U-shaped recessions like the Great Recession or, under the worst-case scenario, an L-shaped recession like Japan experienced in the 1990s). Following the nadir in 2020, recovery in occupancy, average daily room rate (“ADR”), and revenue per available room (“RevPAR”) show recovery patterns resembling that of a V-shaped recession.
The figure below shows the ADR, occupancy rate, and RevPAR for the major US markets from 2000 to 2020 and the July year-to-date figures for 2021.
Average Annual U.S. Urban Market Performance (Year-To-Date)
.jpg)
Historical data on the weekly performance of the major urban US markets shows an unprecedent percentage drop in RevPAR during 2020. With year-over-year RevPAR decline reaching a nadir of -84.94% in April 2020. Compared to previous recessions, the recovery reached year-over-year record rates of 251.52% in April 2021 and has not fallen below 100% year-over-year since. The following figure compares year-over-year percentage change in RevPAR for the major US markets versus the United States as a whole.
.jpg)
During the COVID-19 pandemic, RevPAR declined more severely in major US markets than in the United States as a whole. Beginning in April 2021 and onward, major US markets have outpaced recovery compared to the US as a whole, largely due to the distribution of the vaccine and return of major tourist destinations such as Orlando, Oahu, and New York City.
Employment is a separate metric to measure the rate of recovery in the hospitality industry. The figure below compares the rate of recovery for RevPAR across the United States verus the percentage change in employment throughout the hospitality industry.
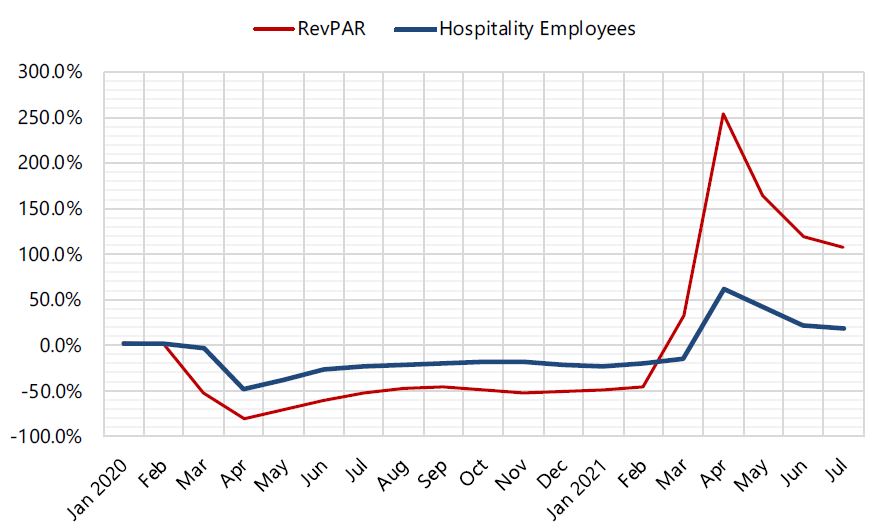
RevPAR declines in 2020 were more severe than the percentage change in hospitality employment and changes in employment appear to lag changes in RevPAR by one month. The trajectory of employment and RevPAR recovery generally mirrored each other.
In the 2020 HVS Lodging Tax Study, we forecasted that the recovery of the lodging industry would mirror the recovery of the industry during the Great Recession. While 2020 matched expectations for declines in the hospitality industry, data from 2021 suggests stronger and faster recovery than expected due to pent-up demand and growth in consumer confidence after a year confined to their homes. The folowing figures compare monthly RevPARs for the total United States and 25 major markets for 2019 through 2021.
.jpg)
Sources: STR (historical) and HVS (projected)
Historical RevPAR 2019 to 2021 (Major U.S. Markets)
.jpg)
Sources: STR (historical) and HVS (projected)
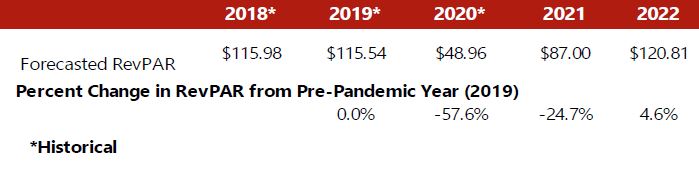
Nationally, monthly RevPAR recovered to 2019 levels in June, but the 25 major US markets have not fully recovered to 2019 levels as of this writing. Year-to-date US RevPARs for the month of July are -25% below 2019 levels while the top 25 urban markets are down -42% from 2019 levels. A weak first quarter, recovery during the second quarter and a strong second half of the year drive our forecasted RevPARs for 2021. The following figure shows the resulting calendar year RevPAR estimates for the major US markets.
Projected Changes in Calendar Year RevPAR Values (Major U.S. Markets)
Depending on the jurisdiction, lodging tax revenue collections occur two to three months after the month in which the tax liability is incurred. For example, hotel stays occurring in December may not produce revenue to the taxing entities until the following February or March. This lag effect on tax collections mitigated the revenue losses in 2020, but will slow recovery of tax revenue receipts in 2021. Due to lag effects, recovery may not be fully captured in tax collections until 2022.
To estimate lodging tax revenues, HVS applied the estimated RevPAR growth rates on a collection year basis (as opposed to a calendar year) to lodging tax revenues. These RevPAR growth rates capture the combined changes in room night demand and average daily room rates. HVS also factored in hotel room supply growth. HVS based its forecast of available rooms on the year-to-date growth in in supply through July 2021.
The following tables show the forecasts of lodging tax revenues in the 25 US cities analyzed in this report.
.jpg)
In 2021, lodging tax revenues in the 25 major markets are estimated to fall short of the baseline by approximately $1.45 billion, which is greater than losses in 2020. Due to lag effects, 2020 captured more non-COVID-19 impacted months than 2021. The rapid pace of recovery through the end of 2021, assuming recovery is not derailed by unforeseen circumstances, suggests that 2022 losses will diminish to under $100 million compared to the baseline. Losses of this magnitude will continue to stress state and local government budgets and local tourism efforts. The recovery of the hospitality industry relies on its personnel and continued losses in lodging tax revenues may prolong an already-tenuous recovery.
The projections contained in this report are based on information available at the time of this writing. Given rapidly changing circumstances, actual outcomes may be materially different from these forecasts. The HVS forecasts are aggegatted for the 25 urban markets included in the study and these projections should not be applied to any single market. Further and more detailed study would be necessary to project the perfomance of any individual market.
Our knowledge of the impact of the COVID-19 pandemic on the hospitality industry will continue to evolve as more information becomes available. HVS will monitor the impact on lodging tax revenues and update our analysis as appropriate.
Historical Lodging Tax Overview
Lodging taxes are typically ad valorem taxes (levied as a percentage of value) on short-term[3]overnight stays at hotels, motels, bed-and-breakfasts and other lodging accommodations. States authorize the imposition of lodging taxes, except in home rule cities.[4] States may tax lodging as a part of general sales and use tax, a specific lodging tax, or both. For most lodging taxes, state legislation defines the tax base, determines who is exempt from the lodging tax, and establishes collection procedures. States and municipal governments may distribute lodging tax revenues to their general funds, special revenue funds, or to local governments and special districts. Certain state and local governments also impose excise taxes on lodging, at a fixed amount per unit, such as a $1.00 per night fee for the furnishing of a hotel room.In certain cities, state and municipal governments have formed special districts to levy additional lodging taxes on hotels located within a defined geographic subset of the city. Different districts within a city may have varying rates of lodging taxes. For example, Sacramento charges a higher special district rate of 3.00% for hotels in Downtown Sacramento and lowers the rate as hotels get further from the downtown area. Revenues from special district assessments frequently support the development of convention centers that generate room revenue for the hotel properties located in the district.
From a political perspective, lodging taxes may be easier to impose than other taxes because visitors that use lodging accommodations are not constituents of the local municipalities. Typically, hotel operators collect the tax from guests and receive a small administrative fee of one or two percent of collections.
While the legal incidence of the tax may fall on the consumer, the economic burden of the lodging tax is shared by both providers of lodging accommodations and their guests. The lodging market is competitive, and in a competitive market, the tax burden is shared between buyer and seller. A lodging tax raises the price of lodging accommodations. Depending on the elasticity of the supply and demand for lodging, the hotel manager may not be able to increase rates by the full amount of the tax. Since the elasticity of supply and demand changes depending on market conditions, the true incidence of a lodging tax varies as market conditions change. This study makes no attempt to estimate the economic incidence of lodging taxes.
Hotel owners are often willing to cooperate with local governments to impose lodging taxes dedicated to tourism promotion and convention center construction. For hotel owners, tourist-oriented public facilities and advertising serve as drivers of room demand. All of the hotels in a given market can benefit from programs that bring tourists and convention attendees to a city. Sponsoring these types of programs would be prohibitively expensive for any individual hotel. In the case of convention centers funded by a lodging tax, the hotels and individuals who benefit from the center pay for its construction and maintenance. Municipalities seek to benefit from visitor spending and the associated tax revenue that convention centers generate. Through the imposition of lodging taxes, those who benefit pay for advertising, marketing and sales efforts funded by lodging tax revenue.
Some states, particularly those with large tourism industries, prevent municipalities from depositing hotel tax revenue into their general funds. For example, Florida allows only a series of special purpose taxes for tourist development. Texas requires that local transient occupancy taxes fund convention center development or tourism promotion.
Since the 1970’s, lodging taxes have become commonplace across the country. Of the 150 largest U.S. cities examined in this study, more than 120 impose a dedicated tax, and all of them collect some form of taxation on hotel room revenue. In small suburban cities and major tourist destinations alike, lodging taxes have become an important source of funding for economic development initiatives. This study attempts to survey hotel tax implementation across the country to provide information for those who wish to compare the structure and revenue capacity of lodging taxes in a diverse set of markets.
Methodology
HVS’s nationwide study examined lodging taxes levied at the state and local level for the 150 most populous United States cities. HVS used data sources deemed to be reliable, including the following: comprehensive annual financial reports, annual adopted budgets, municipal codes, revenue reports, media sources, and interviews with government finance officials to determine the rate, collection, and distribution of lodging taxes at the state, county, city, and special district levels. In most cases, annual revenue figures were drawn from consistent sources year over year. All lodging tax rates, revenues, and distributions are reported in nominal dollars unless otherwise noted.Local Rate Changes
State, county, and local governments passed into law a number of rate changes that took effect during or immediately following fiscal year 2020. Recent changes in lodging taxes in cities include the following:.jpg)
In addition to the state and local rate changes that took place during fiscal year 2020, HVS projects the following changes for fiscal year 2021 and beyond.
.jpg)
State Tax Rates
States with high lodging tax rates typically have more restrictions on the imposition of local lodging taxes. To illustrate, Connecticut has the highest statewide lodging tax rate at 15% but forbids all local authorities from imposing additional lodging taxes. On the other hand, Oregon imposes a low state lodging rate but does not restrict local taxes.
.jpg)
.jpg)
.jpg)
State Lodging Tax Revenue
HVS analyzed annual state lodging tax revenues as stated in comprehensive annual financial reports, the majority of which report revenues on a modified accrual basis. In a few states where the final audited information was not available for fiscal year 2020, HVS recorded government estimates from budget reports. In some cases, government agencies provided annual lodging tax collection data instead of modified accrual data. Accrued revenues are recorded in the period in which the liability for tax payment occurs. Cash collections typically lag the period of liability by at least one month.Depending on the size of their tax liabilities, taxpayers may remit payments monthly, quarterly, or annually.
Administrative charges, payment of back taxes, and penalties may also affect the level of reported revenues, but the amounts are not substantial. In some states, only sales tax revenues in the accommodations sector were available. Whereas lodging taxes are typically applied only to hotel room charges, sector-wide taxable sales might include other sources of taxable revenue such as food and beverage revenue. We did not attempt to estimate the percentage of taxable sales due solely to overnight stays.
Among the states that collect a lodging tax, revenue declined at an average rate of -17.3% from 2019 to 2020. In previous years, lodging tax revenues had steadily grown (5.2% from 2018 to 2019 and 3.9% from 2017 to 2018). The overall decline in lodging tax revenues is largely—if not entirely—attributable to the slowdown of transient and business travel during the COVID-19 pandemic.
Of those states that collect a lodging tax and reported revenues in 2020, 38 reported a decline in lodging tax revenues from 2019 to 2020. Wisconsin reported the largest decline in revenue from fiscal year 2019 to 2020 at -49.52% year-over-year.
The following table presents a six-year history of lodging tax revenue for each of the twenty-five states that have imposed a dedicated lodging tax. Revenue reported from past years has been adjusted for inflation. Data is presented in millions of dollars, and the states are ranked by 2020 revenues.
Rank of States by 2020 Lodging Tax Revenues (millions)
.jpg)
Total Lodging Tax Rates
HVS researched the total tax rate applied to lodging accommodations in the 150 most populous United States cities as projected from the 2010 census. The total tax rate is comprised of all state, county, city, and special district taxes levied on lodging facilities within the urban center of the city where the highest special district taxes may be applied. The following tables list the tax rate applied to overnight stays at lodging facilities at the state, county, city, and special district levels, as well as the total rate imposed on an overnight stay at a lodging facility in the urban center of each of the 150 largest cities in the United States..jpg)
To calculate the special district rate, HVS calculated the tax rate an overnight visitor would pay to stay at the hotel with the highest tax rate within a special taxing district. Due to special taxing districts, the tax rate at a particular hotel can be influenced by its location, size, or other factors that determine tax rates.
The figure below shows a distribution of combined lodging tax rates in the 150 largest U.S. cities.
.jpg)
.jpg)
.jpg)
Source: Respective Jurisdictions
Tax Rates in Top 150 Urban Centers 2020 - Continued
.jpg)
Source: Respective Jurisdictions
Tax Rates in Top 150 Urban Center 2020 - Continued
.jpg) Source: Respective Jurisdictions
Source: Respective Jurisdictions City Lodging Tax Revenue
The following tables describe the lodging tax revenue that the 150 most populous cities collected from lodging taxes. Unless otherwise noted, the tax rate and revenue listed only pertains to the citywide lodging tax and does not include special district taxes or city sales taxes. Consequently, the revenue figures presented for comparable cities can diverge greatly. For example, a city in California with an average lodging tax rate will show greater revenue year over year than a similar city in Nevada, where taxes are levied primarily at the state and special district level. For individual cities, revenues are reported from consistent sources each year.In some states and cities, lodging taxes are imposed by the county rather than city level. For example, cities in Florida, Indiana, and parts of New York do not levy municipal lodging taxes. In such cases, we list county lodging tax revenues. Year-over-year revenue changes may reflect tax rate changes and underlying changes in taxable receipts for lodging.
Of the localities reporting lodging tax revenues in 2020, 136 reported a decline ranging from -0.78% to -81.03%. Chicago, IL reported the largest decline in year-over-year lodging tax revenue growth.
Major tourist destination such as Chicago, Seattle, Washington, DC, Denver, and Cleveland saw declines in their lodging tax revenues as business and leisure travel slowed down or wholly stopped throughout 2020. The decline in convention business at McCormick Place, the Washington State Convention Center, the Walter E. Washington Convention Center, and the Wisconsin Center—alongside many others—surely contributed to a decline in lodging tax revenues. In traditional year, factors such as weather events, seasonality , or budgeted declines in revenue can cause lodging tax revenue to decline from year to year. The effect of these events and conditions in tandem with the further-developing COVID-19 pandemic may exacerbate the decline in lodging tax revenues for these markets.
.jpg)
Source: Respective Jurisdictions
Reported Lodging Tax Revenues in Top 150 Urban Centers ($ Millions) - Continued
.jpg)
Source: Respective Jurisdictions
Reported Lodging Tax Revenues in Top 150 Urban Centers ($ Millions) – Continued
.jpg)
Source: Respective Jurisdictions
Excise Taxes
In addition to percentage taxes on gross room revenues, some hotels are also subject to excise taxes on lodging transactions. States, cities, or special districts may charge a flat fee per room night on all hotel rooms within their boundaries. Excise taxes tend to be less volatile because their amount only depends on the occupancy and is not subject to room price variations. However, excise taxes do not grow with inflation or room rate increases.Hotels in 24 cities are subject to a state, city-wide or special district excise tax. Excise taxes range from $0.75 to $5.00 per room night, with an average of $2.58 . HVS calculated each city’s excise tax as a percent of its per diem rate (in fiscal year 2020 dollars) to estimate effective tax rates. A city’s “effective rate” indicates the average rate a person pays if the excise tax were included as a percent of total sale price. For this example, HVS used the per diem rates set by the U.S. General Services Administration (GSA). The per diem rates set by the GSA are usually lower than the average daily rates at hotels in the specified areas. The chart below is for illustrative purposes only.
On average, every dollar charged in excise tax is roughly equivalent to an ad valorem tax increase of 0.82% for 2020.
.jpg)
Source: HVS, GSA, and Respective Jurisdictions
Room Revenue Trends
Since reporting and payment of lodging taxes are mandatory, data on tax revenue provides a useful way to assess the performance of the lodging industry. HVS estimated the amounts of taxable room revenue in each state and city by dividing the tax revenues by the tax rate. Taxable room revenues are typically less than gross room revenues because most lodging tax laws provide some exemptions such as room rental paid by military personnel or government employees. The figure below shows estimated taxable room revenues for the states and cities for which data is available.
.jpg)
Source: HVS and Respective Jurisdictions
Airbnb Lodging Tax Collections
Short-term home rental services such as Airbnb, HomeAway, and VRBO have grown popular among travelers, with Airbnb being the dominant player in the market. Often called parts of a sharing economy, these peer-to-peer platforms allow homeowners to rent out a spare room or an entire house or apartment to travelers seeking “unique travel experiences” and accommodations. Airbnb has exponentially grown since its founding. In September of 2021, Airbnb reported over seven million worldwide listings across 100,000 cities on its website.In reaction to Airbnb’s growth, cities have been forced to confront challenges related to the impact of rapid growth in short-term rentals. Hoteliers have raised issues of fairness since since short-term rentals are typically subject to a comparable level of regulation, permitting, and taxation. Residents have raised concerns over the neighborhood impacts of transient visitation. In response, many cities and states have imposed new-taxes and regulations on short-term rentals.
To gain legitimacy and permanence within the United States, Airbnb has been urging local governments to allow it to collect and remit lodging taxes on the hosts’ behalf. In the past two years, states and cities have made considerable efforts to collect taxes from Airbnb.
The map below shows the states in which Airbnb applies only local lodging taxes or a combination of state and local lodging taxes.
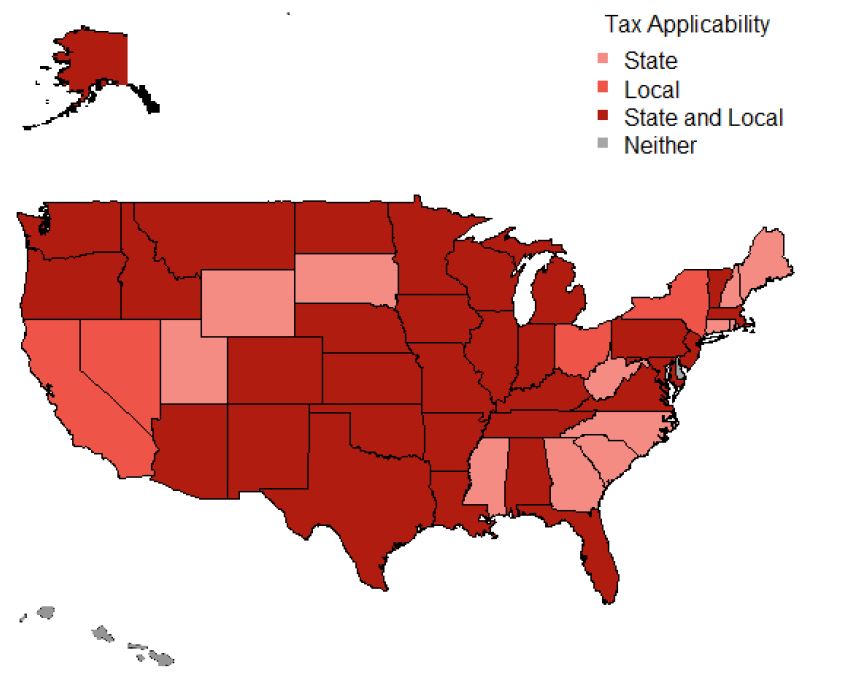
Source: HVS and Airbnb
Disclaimer
HVS’s lodging tax study recognizes that lodging tax rates, collections, and distributions are in constant flux. The data presented herein is HVS’s best attempt to gather the most recently available information. HVS used sources deemed to be reliable and assumes that this information is accurate. All questions, comments, or concerns are welcome in the continuing process to accurately present the current and historical trends of lodging taxes in the United States.[1] COVID-19 Travel Industry Research,” U.S. Travel Association, September 10, 2020. (ustravel.org)
[2] State of the Hotel Industry 2021,” AHLA, January 21, 2021. (ahla.com)
[3] Typically defined in ordinances as being fewer than thirty days.
[4] Home rule cities are cities that have their own taxing authority, have adopted home rule charter for their self-governance, and are not limited to exercising only those powers that the state expressly grants to them.
[5] HVS estimated revenues for each year by computing the revenue change in each city or state for which data was available, then averaging the revenue changes of all cities or states.
About Thomas A. Hazinski
0 Comments
Success
It will be displayed once approved by an administrator.
Thank you.
Error