Houston is the largest city in Texas and the fourth-largest city in the nation. Founded in 1836, the port and railroad industry, combined with the discovery of oil in 1901, induced continual surges in the city's population. In the mid-twentieth century, Houston became the home of the Texas Medical Center, the world's largest concentration of healthcare and research institutions, and NASA's Johnson Space Center, where the Mission Control Center is located. Houston’s long-standing moniker as the “Energy Capital of the World” belies the diversity of its modern economy, which is home to numerous Fortune 500 companies and a variety of industries. Additionally, Houston's population, similar to that of many Texas cities, continues to grow at a steady pace. This trend is primarily attributed to the city's low cost of living, low unemployment, healthcare availability, warm climate, central location, diverse population, and international connectivity.
Houston’s economy is driven by three key factors: the price of oil, the value of the dollar, and the health of the U.S. economy. Two of these have begun to slow, as oil prices have fallen and the dollar’s rising value has had some negative effects on Houston’s vital import/export industry. Nevertheless, hotels in Houston continue to perform relatively well. This is true particularly of average rate, which has continued to improve despite lower demand levels and a decrease in market-wide occupancy. However, the anticipated arrival of more than 5,000 new rooms over the next several years will continue to affect occupancy in the market.
Hotel Market Performance
Overview of Historical Occupancy and Rate Trends
The following charts illustrate forecasted occupancy, average rate, and RevPAR trends for Houston from 2016 to 2018.
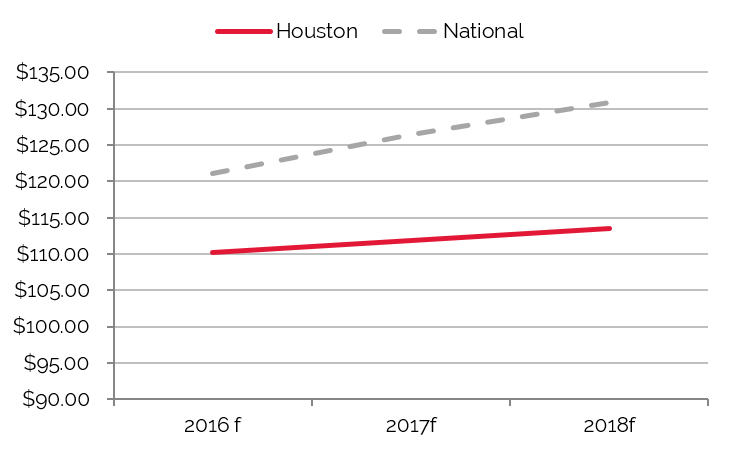
Growth Forecast for Average Rate, but Occupancy and RevPAR Expected to Decline
Houston’s Occupancy Grew through 2014
Nation Outpaced Houston’s Average Rate
Decline Forecast for Houston RevPAR
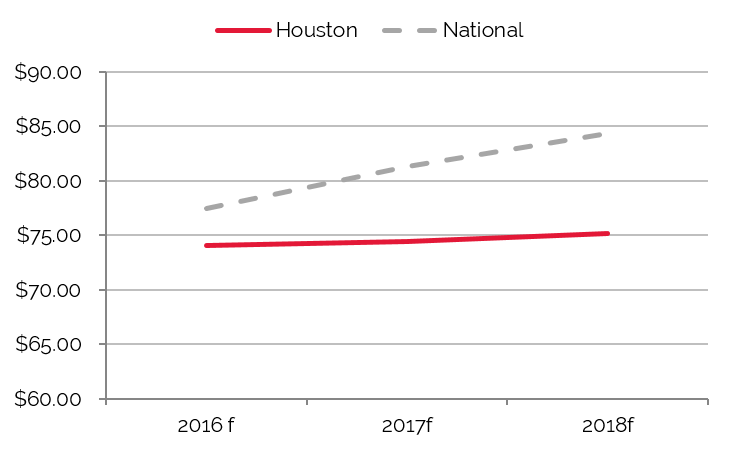
Source: HVS
As witnessed across many markets across the nation, occupancy and average rate plummeted in Houston in 2009 and 2010, the result of a sharp decrease in demand coupled with an 6.0% increase in supply. The advent of new technologies for oil exploration along with the onset of a national economic recovery helped Houston’s hotel market recover fully by 2012. From 2011 through 2014, economic activity in Houston surged across all sectors, and the city’s hotel market experienced positive year-over-year increases in demand, occupancy, and average rate. An increase in demand coupled with the return of financing added more projects to the pipeline of new supply, and today approximately 5,000 rooms are under construction in the market and scheduled to open between 2016 and 2017.
The city’s economic activity began to slow in late 2014 as a result of lower energy prices; the price of oil, which dropped by 50% in the fourth quarter of 2014, remains at a similar level today. Trade and exports, which are also vital to Houston’s economy, decreased by 13% in the 2015 year-to-date period because of the 20% appreciation of the U.S. dollar over the last 18 months.
Despite these economic woes, Houston’s lodging market has not been significantly affected; however, some of the potentially negative effects seem to be beginning to manifest. Occupancy, average rate, and RevPAR reached record levels in 2014. In 2015, occupancy decreased and average rate improved resulting in a RevPAR decrease. It is important to note that despite the decrease in occupancy, the hotel market finished 2015 well above the market’s ten-year average.
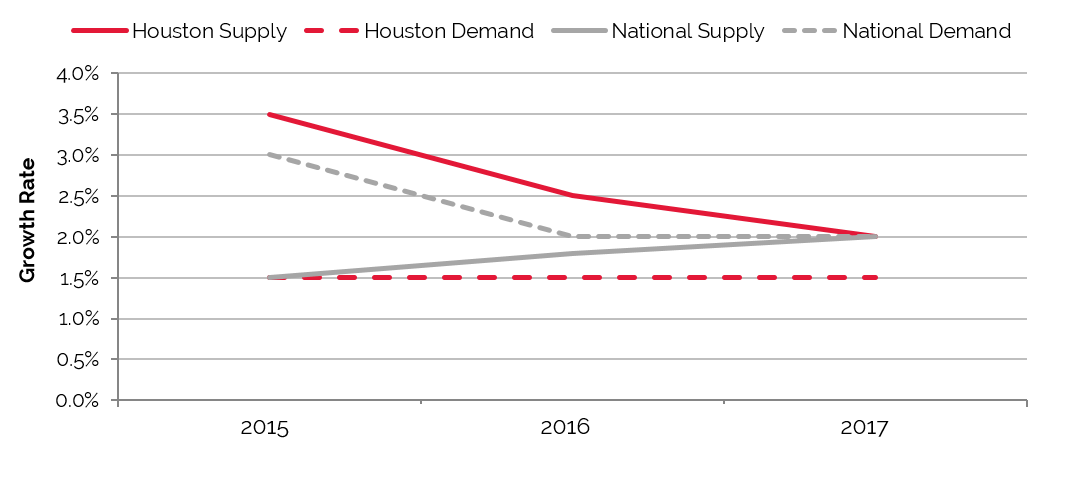
Houston Demand Remains Relatively Stable through 2018
Source: HVS
As the above chart illustrates, supply and demand aligned in 2014, resulting in market equilibrium. However, this effect is likely resulted from a increase in energy-related demand that year. It is anticipated that demand levels will recover by 2017. This trend is expected to result in a stabilized occupancy level of 66%, which is above the ten-year average for the Houston market.
Existing Supply Breakdown by Brand and Scale
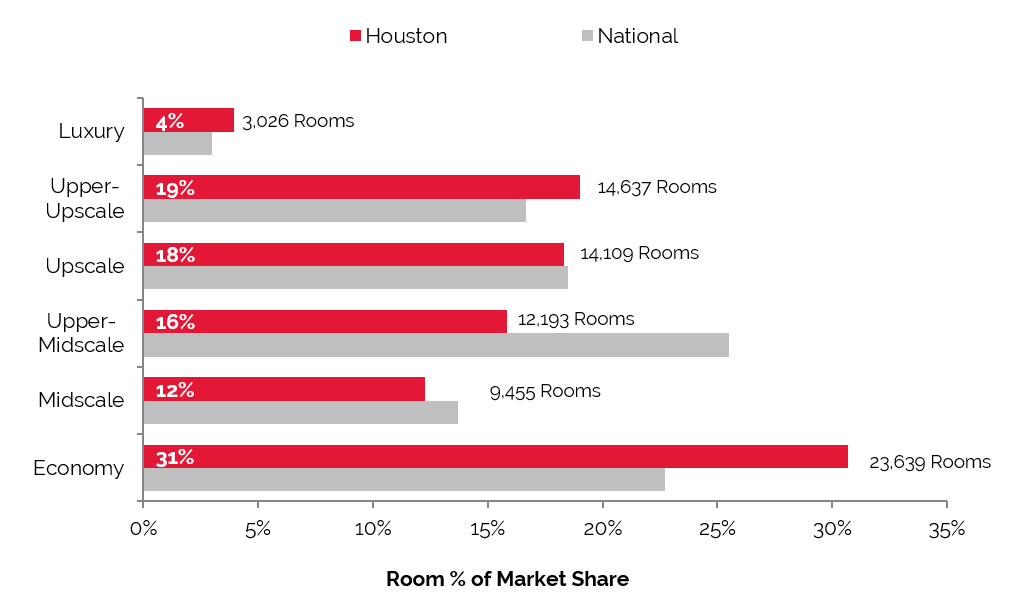
The Houston area is home to approximately 800 hotels and 77,000 rooms, making it one of the top ten hotel markets in the U.S. in terms of total room count. Economy and midscale hotels represent 43% of the market’s supply, while upper-midscale, upscale, and upper-upscale hotels together account for 53%. Eleven properties, or 3,000 rooms, are classified as luxury hotels in Houston, accounting for just 4.0% of the market’s room supply; despite this official classification, however, only a handful of these hotels would be considered true luxury properties by consumers. Houston remains underserved by luxury hotels; however, the city’s historical average rates have generally not supported the construction of luxury hotels in the current environment. The tide appeared to be turning in late 2014 when the market’s performance was at an all-time peak and the advent of new luxury hotels was becoming more likely. Nevertheless, developers that are able to minimize construction costs and maximize hotel revenues through creative strategies have a better chance of bringing luxury or high-end boutique projects to fruition.
Largest Portion of Rooms in Houston is Economy,
While Upper-Midscale Class Leads the Nation
Source: STR
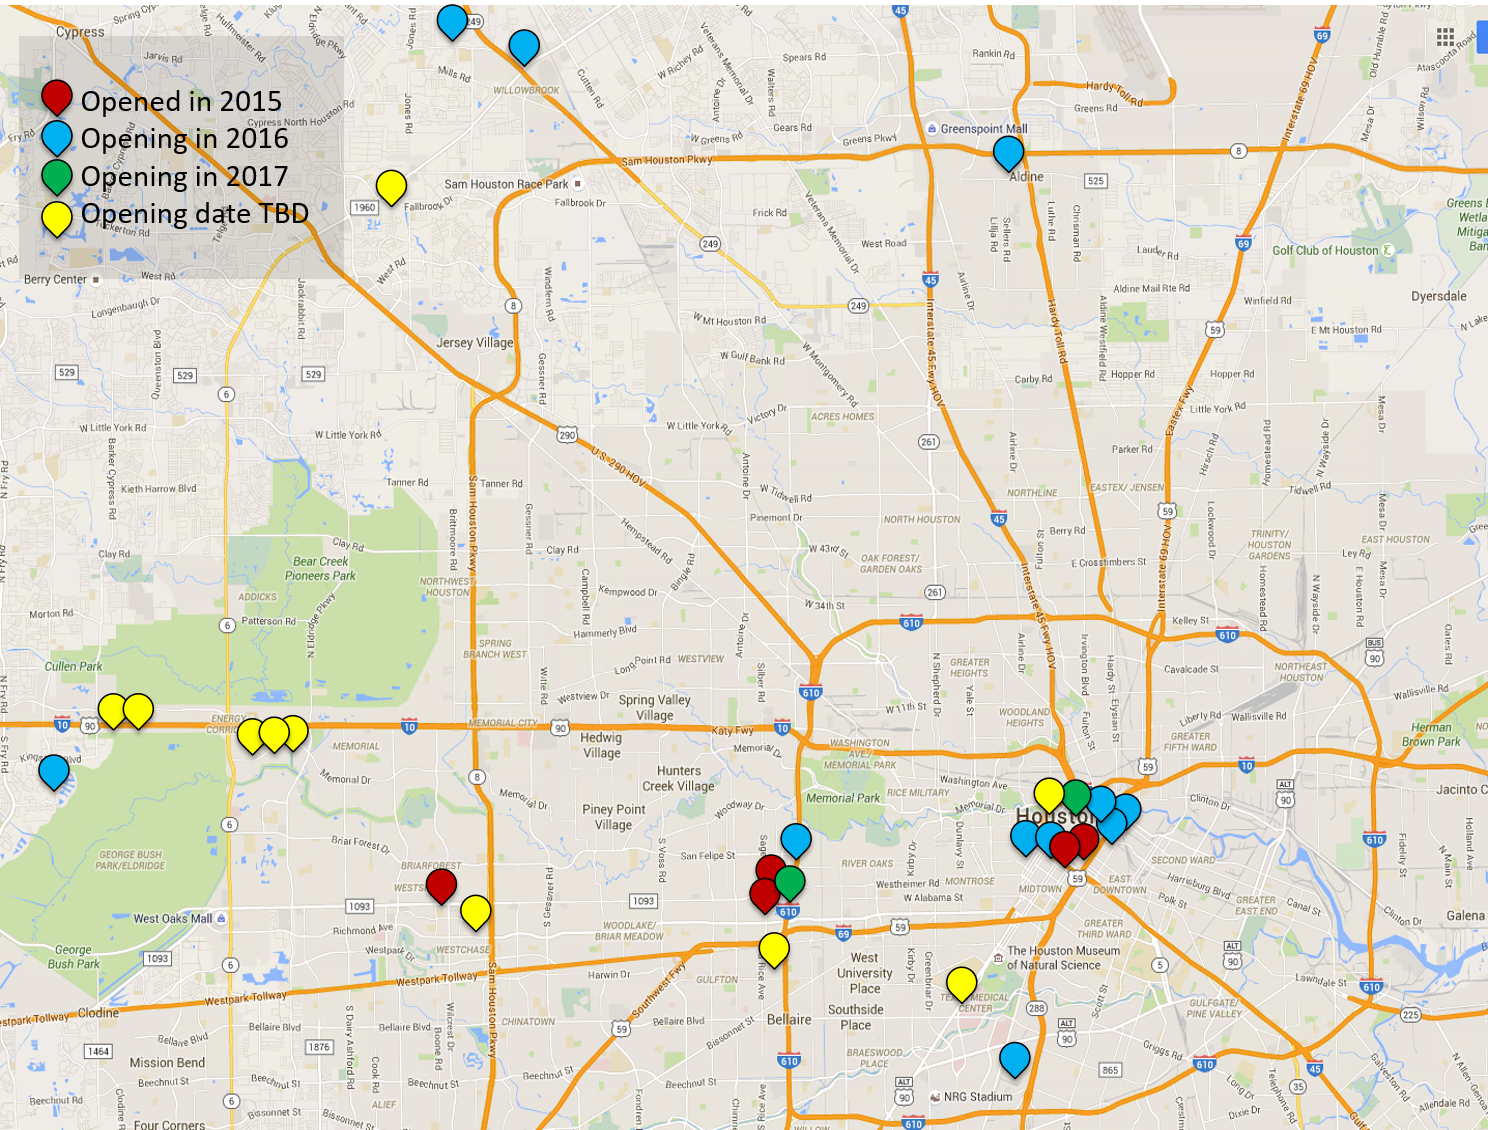
New Supply Pipeline
Hotels belonging to the upper-midscale to upscale classes are expected to dominate the new supply pipeline in 2016 and 2017, driven by the increasing popularity of limited-service and select-service brands. Downtown Houston will lead the way with the largest supply increase in the coming years (approximately 45% over the existing supply is under construction in this submarket).
The table below reflects an increase of a minimum of 5,530 rooms, including seven proposed properties with an undetermined room count. The inclusion of proposed hotel projects that have not yet been made public would put the supply increase at approximately 6,500 rooms, or 8.5%.
More Than 5,500 Hotel Rooms Could Come to Houston in the Next Two Years,
Majority of New Hotels are Proposed for Downtown Houston
Approximately 2,500 rooms, representing 45% of the planned citywide increase in supply, are proposed for just the Downtown submarket. Downtown Houston continues to undergo a renaissance with a multitude of residential and office projects planned for this submarket. According to the Downtown District, there are nine multi-unit residential properties under construction, which will add roughly 2,700 units to the existing 8,424 units in this submarket. Additionally, multiple office buildings totaling 5,500,000 square feet are also under construction and slated for completion by 2017.
The other two Houston area submarkets that will receive a notable increase in supply include the Galleria and Energy Corridor. The Galleria area, also known as Uptown Houston, is home to the second-largest business district in the city and the epicenter of tourism for Houston. The Galleria mall attracts visitors year-round, primarily from Mexico and Latin America. Strong weekend visitation allows this submarket to realize the highest occupancy levels in the city, approaching the 80% mark in recent years. The Energy Corridor is home to many of the city’s energy firms or oilfield service companies. As can be expected, this submarket has been hardest hit by the weaker energy sector.
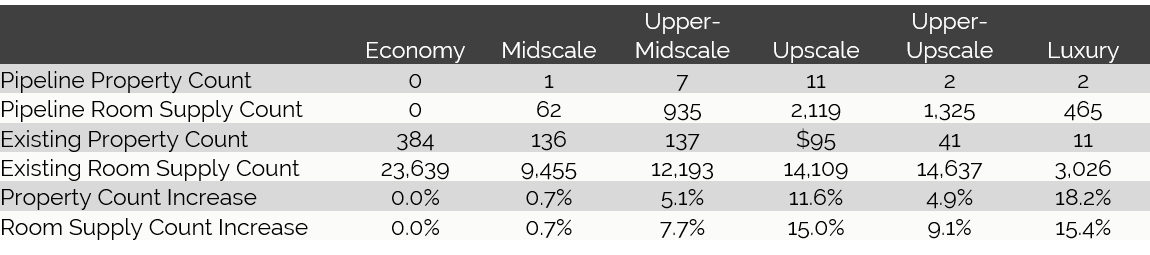
Of the property classes and room counts that have been determined, the following chart illustrates the class breakdown of the new supply.
Houston’s Upscale Inventory set to Increase More Than 18%; Economy Inventory to Stabilize
Source: HVS, STR, and BuildCentral, Inc.
Hotel Valuation Expectation
The annual
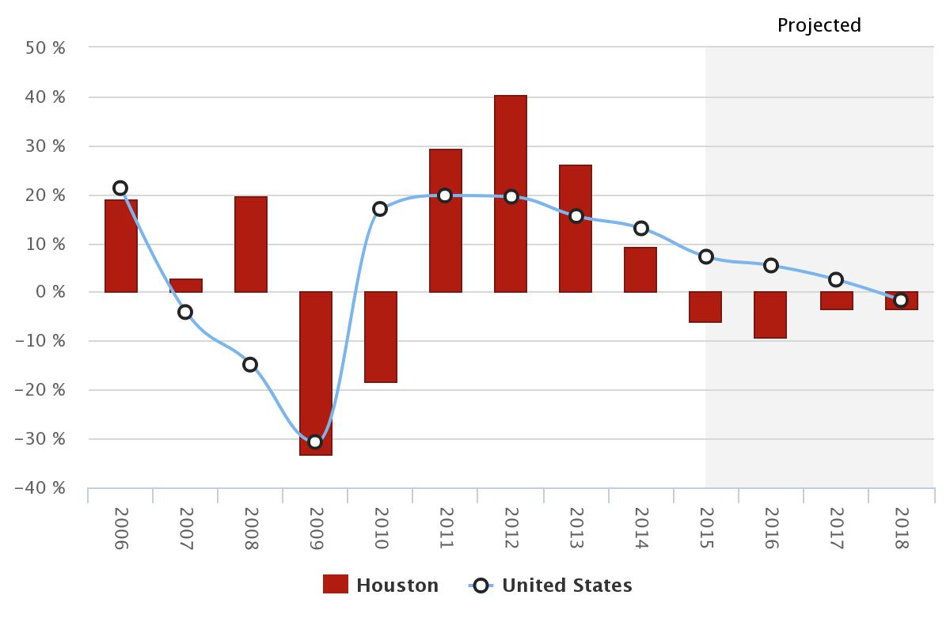
HVS Hotel Valuation Index (HVI) compiles data derived from over 4,500 hotel appraisal assignments each year, providing for analysis of performance and forecasts for hotel markets nationwide. The Houston hotel market achieved annual RevPAR growth of roughly 12% from 2011 through 2014—a remarkable achievement that places Houston among the top markets for growth in the nation. Market-wide occupancy surpassed 70% in 2014, and average rate fell just shy of the $107 mark that year.
The HVI also provides insight into hotel values. In 2014, Houston ranked 37th among 65 major U.S. cities in hotel value growth; hotel values in Houston rose by more than 9% that year. Due to factors previously mentioned, Houston hotel values are anticipated to decrease by 6% in 2015, with a decrease of 20% between 2015 and 2018.
The following chart illustrates the trajectory of hotel values in Houston from 2006 through 2018.
Growth in Hotel Value to Slow After 2015
Ratings are comparable to 65 major U.S. cities, including the nation.
Hotel Transactions
The following graph details confirmed hotel transactions in Houston since 2012.
Hyatt Market Street The Woodlands Leads Per-Key Value
Transactions per Submarket
Source: HVS and RCA
Until recently, transaction activity had been strong in the Houston area, with buyers competing heavily for the limited number of assets for sale, and sellers seeking to monetize their investment gains. Although sale prices have averaged just over $140,000 per room over the last three years, pricing is highly dependent on historical operations, location, product type, and if the property was under financial distress.

The sales above, which totaled approximately $1.4 billion in transaction volume, include such trophy assets as the Four Seasons Houston, whose price of $140 million was the highest paid in the Houston MSA. The Hyatt Market Street – The Woodlands recorded the highest price per room, at $368,000.
Transaction activity is expected to slow in 2015 due to uncertainty in the energy sector, which remains the city's major demand generator. The city's top submarkets for investors remain the Galleria and Downtown. Overall, the outlook for the Houston area has changed from positive in 2014 to cautiously optimistic in 2015 and 2016.
In comparison, transaction activity nationwide remains strong, with an ever-increasing number of transactions and higher prices per room. The following charts illustrate transaction activity nationwide over the last ten years.
Number of Major U.S. Sales ($10M and above)

Average Price per Key in the U.S.

Source: RCA
Key Economic Indicators
Economic and Demographic Review
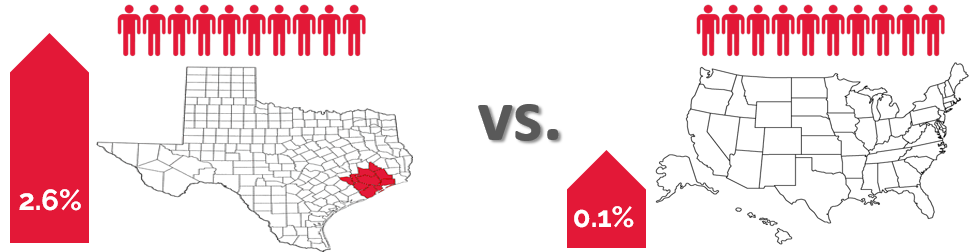
The U.S. population grew at an average annual compounded rate of 0.9% from 2010 through 2015, and that rate is forecast to continue into 2020. For the same period, Harris County’s population growth increased at a rate of 1.7%. The Houston MSA exceeds the county, state, and nation, with a compounded average annual growth rate of 1.9% from 2010 to 2015 and a projected continuation of this rate until 2020. This growth rate is being spurred, in part, by strong job growth in the Houston metro area, which will be discussed in more detail later in this report.
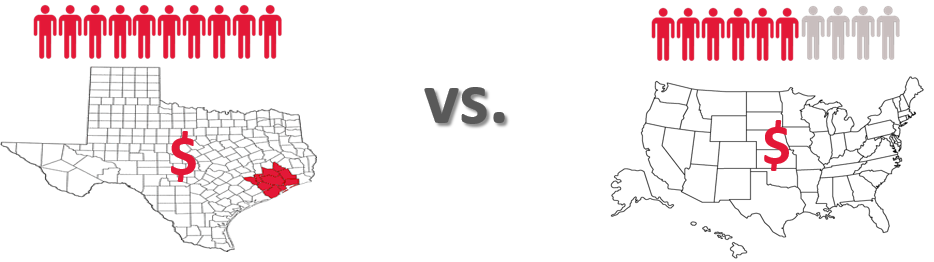
The average annual compounded growth rate of per-capita personal income for the county between 2010 and 2015 of 1.6% was just above the national average of 1.2%. Anticipated growth into 2020 for Harris County is 1.4%, versus 1.3% for the nation. Anticipated growth into 2020 for the Houston MSA exceeds the national growth rate of 1.3%.
Houston's MSA average annual compounded growth rate of resident population has been more than twice of the nation's.
Average annual compounded growth rate of per-capita personal income for the MSA was 40% higher than the nation's from 2010 to 2015.
Source: Woods & Poole Economics, Inc.
The national wealth index for the country trended flat from 2000 to 2015; it is anticipated to remain flat into 2020. The Harris County wealth index has grown 0.3%, while the Houston MSA is at a 0.3% rate of growth. Both rates are expected to remain relatively flat for the next five years.
Food and beverage sales in the county grew at an annual compounded rate of 3.0%, with $6.9 million in 2010 and $8.1 million in 2015. Through 2020, the pace of growth is expected to moderate slightly to 2.6% for the county. The Houston MSA reflects a stronger trend, with $9.1 million in 2010, $10.7 million in 2015, and a projected $12.3 million in sales in 2020. This corresponds to average annual compounded growth rates of 3.2% from 2010 to 2015 and 2.8% from 2015 to 2020, which is 0.6% higher than the national anticipated growth rate of 2.2%.
The retail sales sector for the county was again outpaced by the Houston MSA. The MSA demonstrated an average annual compounded growth rate of 3.4%, with $78 million in 2010 and $92 million in 2015. This sector is expected to remain 0.9% higher than the national average into 2020, with a 2.8% growth rate.
Radial Demographic Indicators
The following table reflects radial demographic trends for the market area measured by three points of distance from the center of Downtown Houston.
Demographics by Radius from the Center of Town
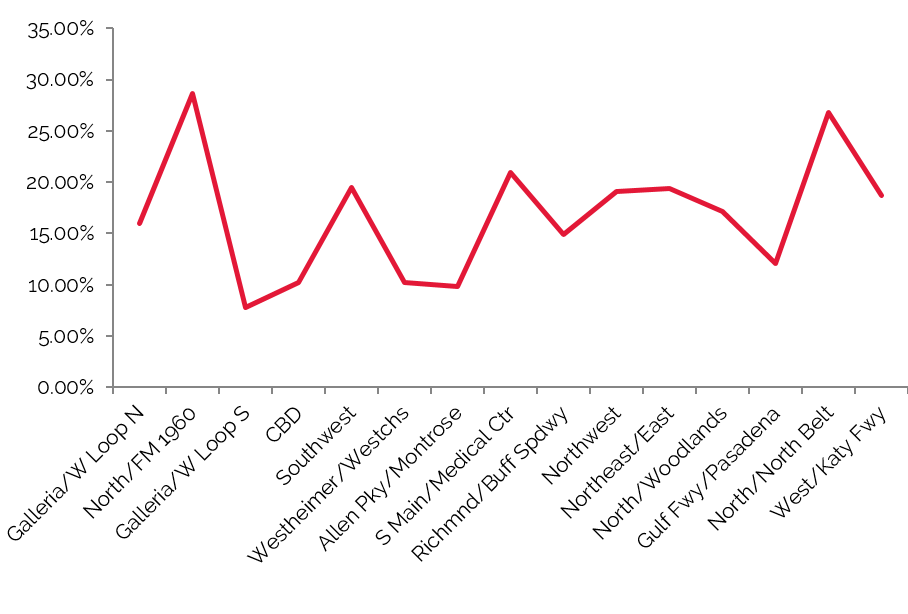
Population Growth to Decline within One-Mile Radius 2015–2020

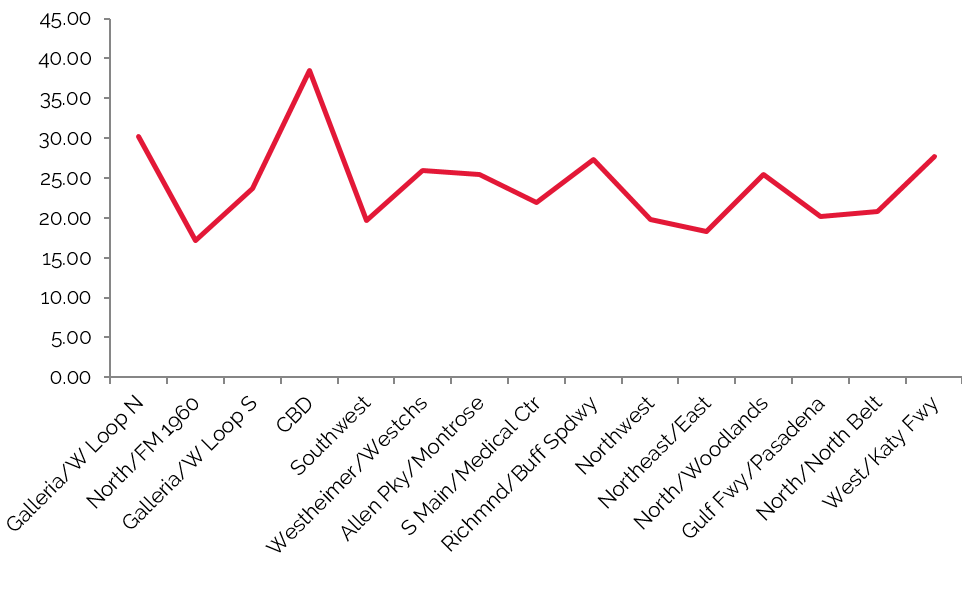
Household Growth Most Stable within Five-Mile Radius 2015–2020

Source: The Nielsen Company
Top Five Occupations – Estimated for 2015
Within 10-Mile Radius

Within 20-Mile Radius

Within 30-Mile Radius

Source: The Nielsen Company
Population growth has been evident throughout the Houston MSA, with the most significant growth in areas within 30 miles of Houston, reflecting the growth of suburban communities. This growth will be more pronounced in the coming years, with the MSA’s population projected to grow roughly 25% from 2015 to 2020. Slower growth is expected in the closer-in urban areas due to rising land prices and limited opportunities for large-scale residential construction.
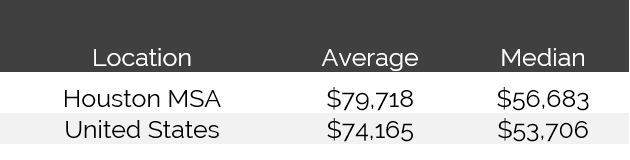
Houston’s forecasted 2015 average and median household incomes are strong in comparison to the nation.
2015 Forecast of Average and Median Household Income
Source: Claritas
Workforce Characteristics
The characteristics of an area’s workforce provide an indication of the type and amount of transient visitation likely to be generated by local businesses. Sectors such as finance, insurance, and real estate [FIRE]; wholesale trade; and services produce a considerable number of visitors who are not particularly rate-sensitive. The government sector often generates transient room nights, but per-diem reimbursement allowances often limit the accommodations selection to budget and mid-priced lodging facilities. Contributions from manufacturing, construction, transportation, communications, and public utilities [TCPU] employers can also be important, depending on the company type.
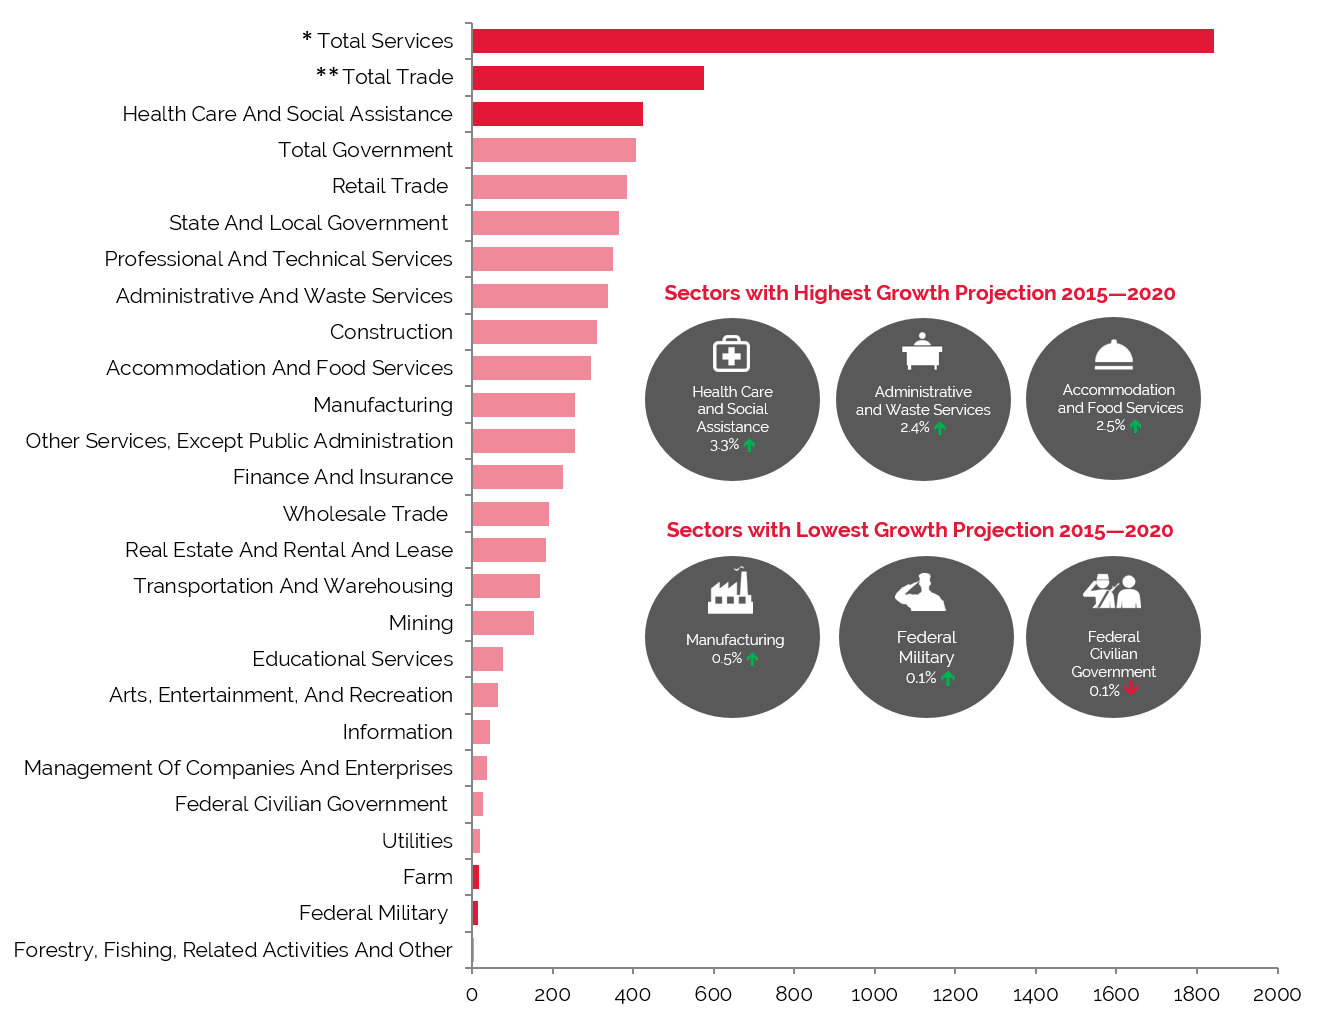
Employment Projections through 2020 Show Impressive Growth in Health Care and Social Assistance, Administrative and Waste Services, and Accommodation and Food Services
Source: Woods & Poole Economics, Inc.
* Total Services include Professional and Technical Services; Management of Companies and Enterprises; Administrative and Waste Services; Educational Services; Healthcare and Social Assistance; Arts, Entertainment, and Recreation; Accommodation and Food Services; and Other Services, except Public Administration
Woods & Poole Economics, Inc. reports that during the period from 2000 to 2010, total employment in the county expanded at an average annual rate of 1.6%. This rate was below the 2.0% growth recorded by the MSA, but exceeded the national average of 0.7%. More recently, the county’s pace of employment growth rose to 2.0% from 2010 to 2014, and the MSA’s growth rate jumped to 2.1%. Looking ahead to 2020, the MSA’s pace is predicted to remain at 2.0%, 54% higher than the national average.
As stated above, finance, insurance, and real estate [FIRE]; wholesale trade; and services are employment sectors that drive upper-midscale through luxury room nights. These sectors combined represented 56.8% of total employment in 2015, with an average annual compounded growth rate for the group expected to equate to 2.15% into 2020.
The largest primary sector was Total Services, which recorded the highest increase in number of employees during the period from 2010 to 2015, when this sector expanded by approximately 204,000 people, or 2.7%, and rising from 41.2% to 42.6% of total employment. Of the various sub-sectors included in Total Services, Health Care and Social Assistance was the largest.
Considered an economy room-night driver, the growth rate of the Total Government sector has been slowly contracting from 1.7% for the decade preceding 2010, to 0.3% from 2010 to 2014, to an anticipated 0.9% into 2020. However, the sector succeeds at maintaining approximately 10% of total employment.
Employment
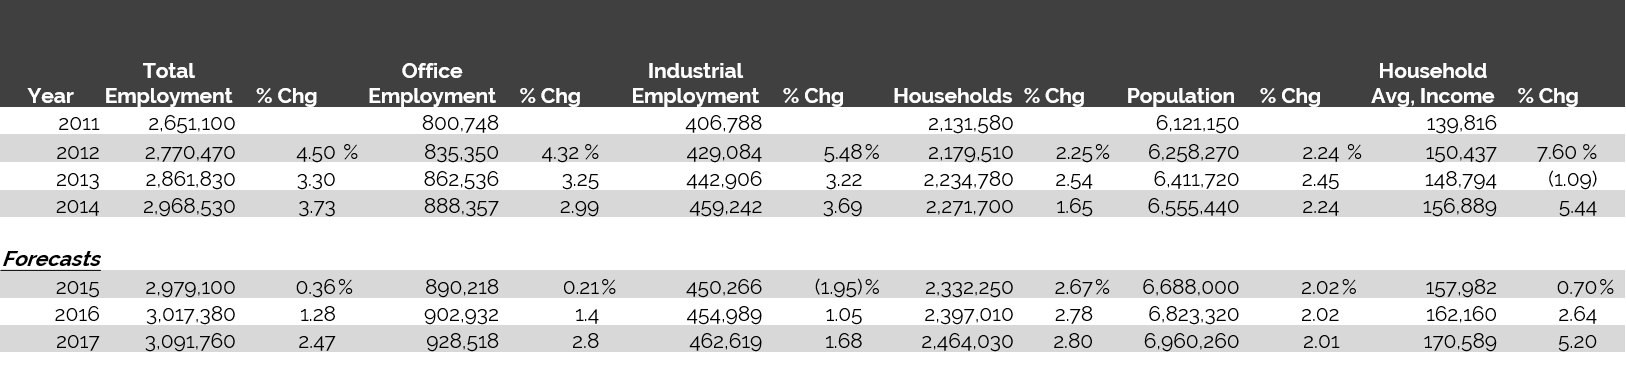
The following table illustrates historical and projected employment, population, and income data for the overall Houston market as presented by REIS.
Historical & Projected Employment, Households, Population, and Household Income Statistics
Source: REIS Report, 3rd Quarter, 2015
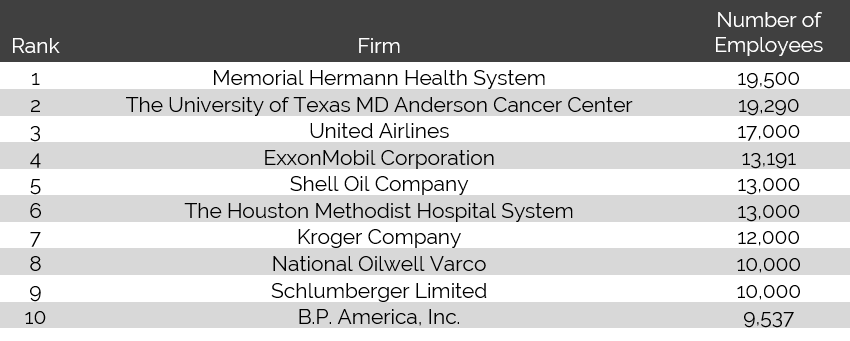
Top Industries In Houston
The following table presents a list of the major employers in the market:
Source: City of Houston Comprehensive Annual Financial Report, 2014
With more than 120 hospitals within the metropolitan area, Houston is a world leader in medicine and boasts the world's largest medical complex, the Texas Medical Center. Approximately seven million patients are treated each year in the Texas Medical Center, a centralized facility created in 1943. The Texas Medical Center’s 52 non-profit and government institutions include academic institutions, hospitals, medical schools, and nursing schools. The Texas Medical Center currently features 45.5 million gross square feet of patient care, education, and research space distributed over 280 buildings. Planned projects include new hospitals, clinics, research space, and other office space by Texas Medical Center institutions along with city, county, state, and federal investment for infrastructure. Ultimately, the Texas Medical Center is projected to total 59 million gross square feet of medical space.
Houston is home to 26 companies on the 2015 Fortune 500 list. According to the Greater Houston Partnership, 66 of the world's 100 largest non-U.S.-based corporations have operations in Houston. With over 250 project announcements, Houston ranked second in the country in Site Selection Magazine's "Top Metros for Corporate Facility Location” in 2014. The Port of Houston is the busiest port in the U.S. in terms of foreign tonnage, second busiest in the U.S. in terms of overall tonnage, and thirteenth busiest in the world. In 2014, Global Trade Magazine named the Houston area second in the country for global trade. Moreover, the widening of the Panama Canal in April 2016 is expected to bolster growth in Houston's trade activity.
Additionally, the George Bush Intercontinental Airport has remained the largest U.S. hub for Chicago-based United Airlines, adding to the city's global connectivity. Over the past quarter of a century, international travel has increased substantially as a percentage of total travel. This trend reflects Houston's transformation to a global city; Forbes named Houston "America's Next Great Global City" in a 2013 article titled "A Map of America's Future: Where Growth Will Be over the Next Decade."
The energy industry drives Houston’s economy. ExxonMobil is the largest publicly traded integrated oil and gas company in the world and the largest corporation by market capitalization. The corporation’s oil exploration, extraction, shipping, wholesale operations, and chemicals divisions are located throughout the Houston area. Additionally, ExxonMobil's Baytown Refinery, located just east of Houston, is the largest oil refinery in the United States. ExxonMobil will be consolidating its Houston offices, as well as other national offices, into a three-million-square-foot campus development near The Woodlands, just north of Houston. The project, which is anticipated to house 10,000 ExxonMobil employees, was slated for full occupancy by September 2015.
Other major oil and gas companies with a strong presence in the Houston area include ConocoPhillips, Marathon Oil, Shell Oil, Chevron, BP, Anadarko Petroleum Corporation, and Apache Corporation, while major oilfield services companies include Baker Hughes, Halliburton, KBR, and Cameron. Schlumberger, National Oilwell Varco, and Fluor have a strong presence throughout Houston, as well. Plummeting oil prices along with lower anticipated production and exploration spending in the coming years has caused companies like Schlumberger and Halliburton to lay off some 9,000 and 6,400 employees, respectively, thus far in 2015. It is not yet clear how many of these layoffs will affect the companies' Houston-based employees, but local economic officials are concerned. In July 2015, the Greater Houston Partnership revised its 2015 job creation projections to 30,000 new jobs, a significant decline from the 62,900 jobs predicted in December 2014. In 2013, Chevron announced plans to construct a 50-story office building in the Houston CBD. The 1.7-million-square-foot tower will support employee relocations to Houston; however, construction has been delayed due to an internal focus of resources on other developments.
A period of rapid growth during the last ten years brought an influx of new residents, housing communities, commercial developments, and employers to the region. Since late 2010, Houston has added 2.4 jobs for every job lost during the recession, and the city's economy has received numerous accolades; however, the decline of Houston's energy industry and weakening employment levels have prompted some uncertainty in the market. Officials at the Greater Houston Economic Partnership expect to see employment growth of 30,000 total jobs in 2015 in all sectors except for oilfield services, oilfield equipment manufacturing, and oilfield exploration. While this pace is much slower than other years since 2011, which averaged 100,000 new jobs, Houston still has one of the strongest economies in the nation. Despite falling oil prices, Houston topped the Forbes list of "America's Fastest-Growing Cities" in 2015, up nine places from 2014.
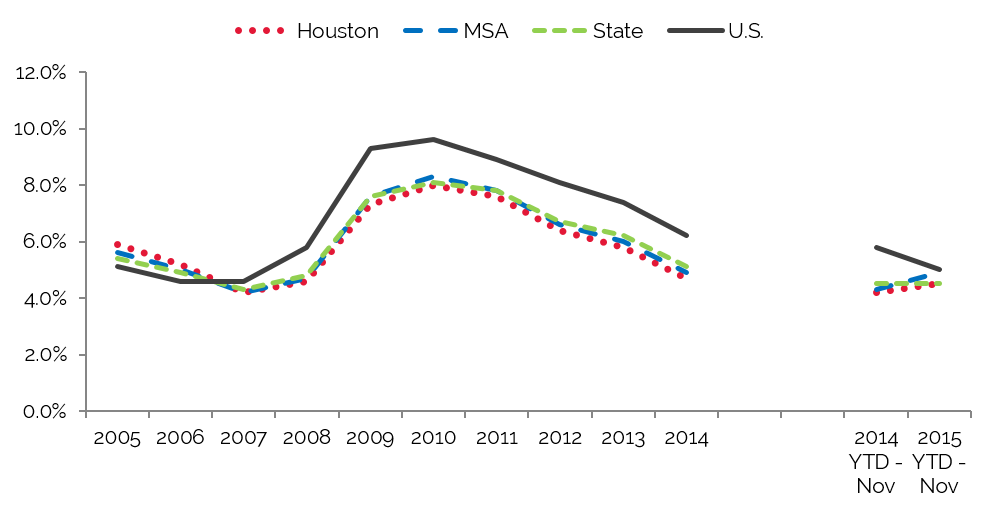
Unemployment
The weakening of the national economy in 2008 and 2009 brought higher unemployment levels through 2010. Unemployment levels in the region began recovering in 2011, with unemployment continuing to decline through 2014. The most recent comparative period illustrates further improvement, indicated by the lower unemployment rate in the latest available data for 2015.
We note that local unemployment remains below the national average. According to the Greater Houston Partnership, job growth has been prevalent in the construction, healthcare, and leisure and hospitality sectors. Furthermore, the strength of the hydrocarbon and technology industries and an improvement in the real estate market should support Houston’s economic fundamentals and allow for some job growth in 2015, despite layoffs at some of the Houston-based energy companies.
Improving Unemployment Levels Since 2010
Source: U.S. Bureau of Statistics
Office Space
Trends in occupied office space are typically among the most reliable indicators of lodging demand, as firms that occupy office space often exhibit a strong propensity to attract commercial visitors. Thus, trends that cause changes in vacancy rates or in the amount of occupied office space may have a proportional impact on commercial lodging demand and a less direct effect on meeting demand. The following graphs detail office trends in the identified Houston submarkets, per REIS.
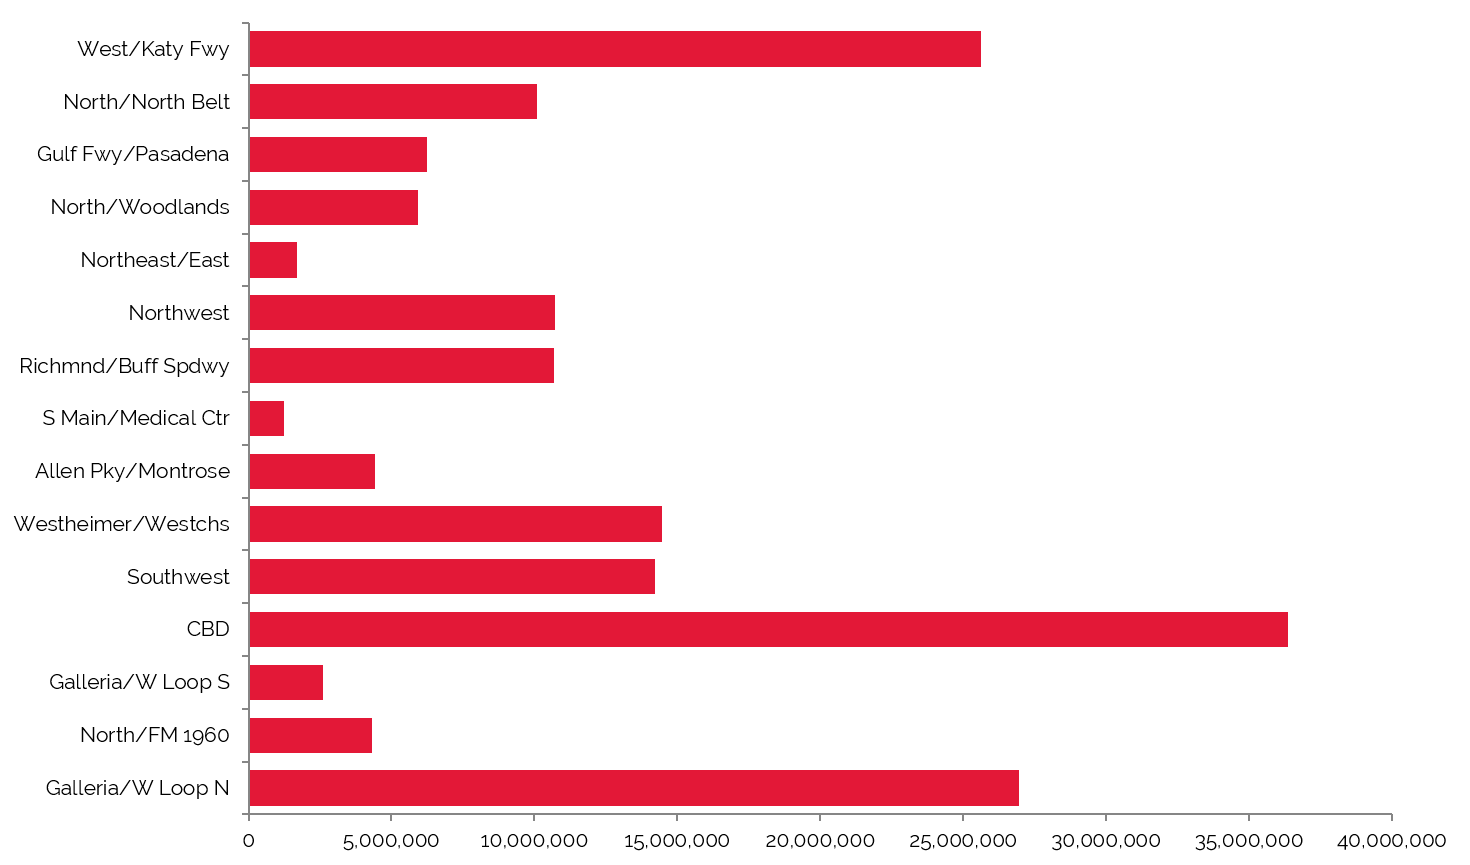
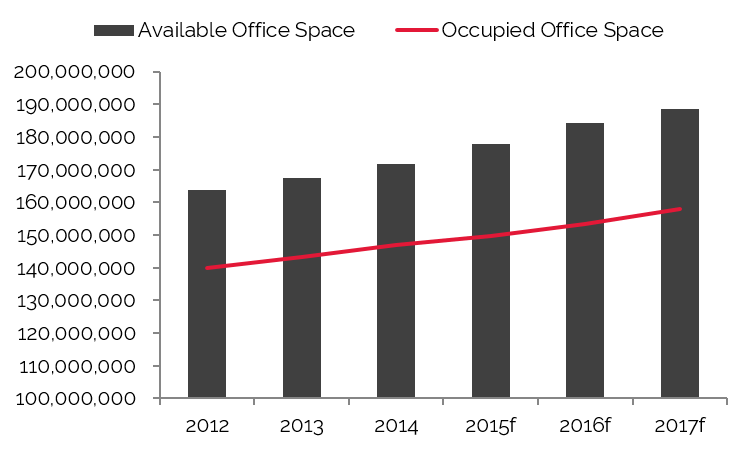
CBD & Galleria Submarkets Feature the Most Office Space
Source: REIS Report, 3rd Quarter, 2015
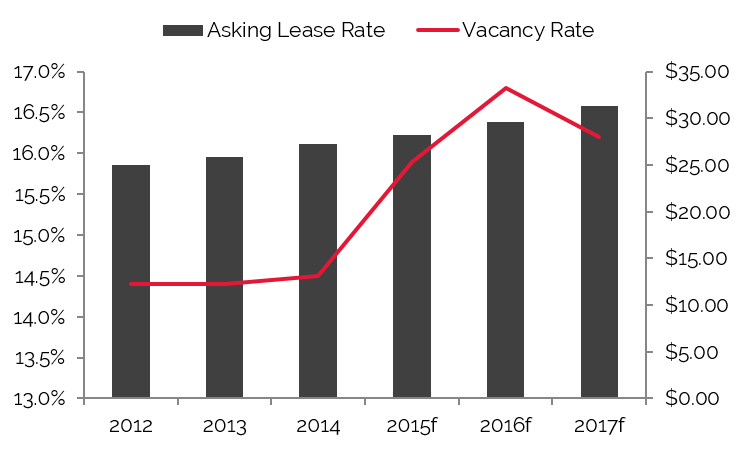
Galleria Demonstrates the Lowest Vacancy Rate
CBD Outperforms Overall Market in Average Lease Rate
Source: REIS Report, 3rd Quarter, 2015
Greater Houston’s 172 million square feet of office space had an overall vacancy rate of 15.0% and an average asking rent of $27.49 for the third quarter of 2015. Houston’s abundance of Class A office space has made the city one of the most desirable in the south-central U.S.; revitalization efforts throughout the CBD and areas such as the Galleria have also helped make the city attractive to office tenants. With the most rentable square feet among all of Houston's submarkets, a low vacancy rate, and the highest rental rates, the CBD office market has proven to be a major hub for much of the city's growth and demand. High demand, in fact, has spurred the construction of 18 million square feet of office space throughout Houston, with 5.5 million square feet in Downtown Houston alone; this new office space supply is planned to enter the market between now and 2017.
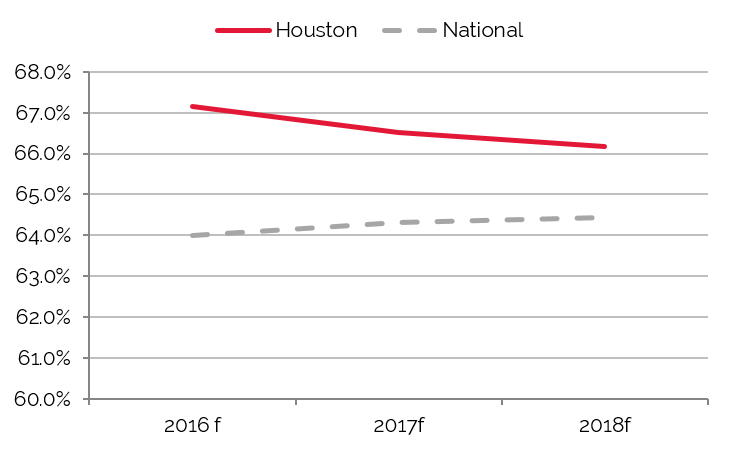
Office Space Expected to Grow Steadily
Vacancy Rate Anticipated to Drop by 2017
Source: REIS Report, 3rd Quarter, 2015
Tremendous growth of new-build office space in the Houston market should foster an expanded corporate climate for the area, which is expected to produce additional commercial hotel demand going forward.
Convention Activity
Convention centers generate significant levels of demand for area hotels, particularly those within a radius of three miles. Convention headquarters hotels command premium rates and, in addition to capturing event-related demand, can also benefit from hosting related banquet events. Major conventions also push demand to peripheral hotels in the market.
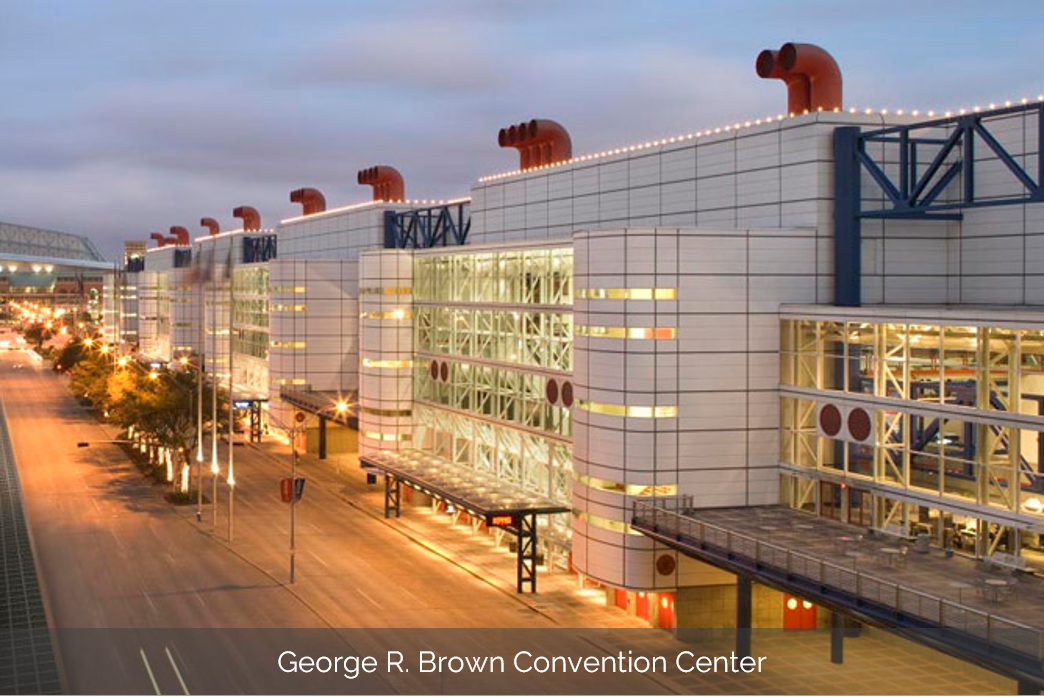
The George R. Brown Convention Center (GRB), located in Downtown Houston, opened in 1987. The most recent expansion was completed in 2003, adding three exhibit halls and sixty-two meeting rooms. This brought the center to a total of 639,000 square feet of contiguous exhibit space on Level I; 100,000 square feet of contiguous registrations space on Level II; and 123,000 square feet of meeting rooms, a 31,590-square-foot ballroom, 223,000 square feet of exhibit space, and a general assembly theater with tiered seating for 3,600-people on Level III. Together, these spaces comprise approximately 1,800,000 square feet, making the center one of the largest in the country.
The 2025 master plan, released in 2012, identified the most pressing issue as the need for additional hotel rooms proximate to the convention center, claiming an immediate need for at least 1,000 hotel rooms. In late 2012, Houston First, the entity that manages the convention center, selected RIDA Development Corporation to develop a 1,008-room hotel.
The Marriott Marquis, which began construction in early 2014 next to the GRB, is expected to open in 2016. Concurrent with the construction of the Marquis, Houston First will reportedly build a 1,900-space parking garage north of the GRB and restructure the front entrance of the center to feature several retail pad sites. Additional development in this area is anticipated to create a Convention District, which should feature restaurants, bars, and retail shops at the street level. While there will be no plans for expanding the center until more hotel rooms enter the market and increased convention activity dictates a need for more space, the third phase of expansion will likely be attached to the southern end of the existing building.
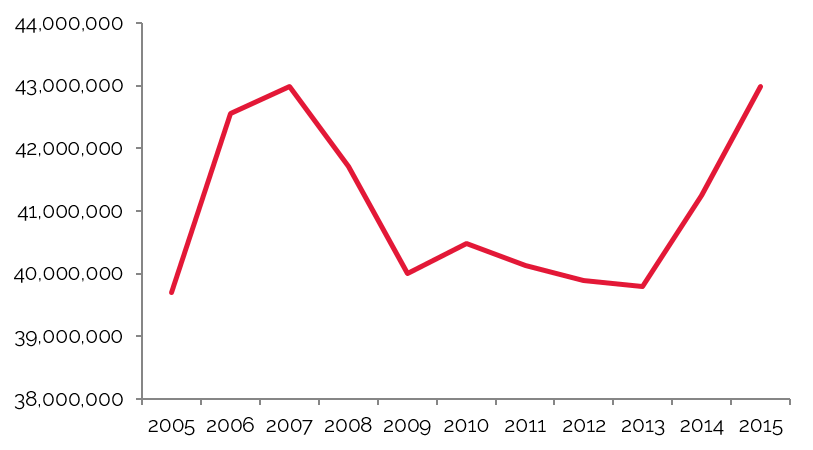
Number of Convention Attendees to Increase with Marriott Marquis Opening in 2016
Source: George R Brown Convention Center Houston
The number of events held at the convention center improved year-over-year following the center’s expansion from 2003 through 2008. Furthermore, the addition of the adjacent 1,200-room Hilton of the Americas allowed for the accommodation of some larger citywide conventions. Following declines in the number of meetings from 2009 through 2012, largely due to the residual effects of the recession, this figure increased in 2013 and 2014. However, the number of attendees in 2014 declined nearly 17% because of the cyclical nature of meetings at the convention center and that fact that 2013 had been a banner year for major events like the 2013 NBA All-Star Celebrity Game and the 2013 NBA Jam Session. While the number of meetings held in 2014 was still below pre-recession levels, the convention center is anticipated to surpass previous highs once the 1,008-room Marriott Marquis convention hotel opens in 2016.
Airport Traffic
Airport passenger counts are important indicators of lodging demand. Depending on the type of service provided by a particular airfield, a sizable percentage of arriving passengers may require hotel accommodations. Trends showing changes in passenger counts also reflect local business activity and the overall economic health of the area.
George Bush Intercontinental Airport (IAH) is located approximately 16 miles north of Downtown Houston. The airport features five terminals and five runways. In addition to being the primary hub for United Airlines, IAH is served by most major domestic and international commercial airlines. The airport's strategic location in the south-central portion of the United States promises to keep it as one of the country's major gateways to the world. In 2013, the airport completed a $1-billion, five-year renovation project that included a variety of updates throughout the airport and the expansion of Terminal B from 360,000 square feet to roughly 1.7 million square feet. The Terminal B lobby and baggage claim areas were rebuilt, a new south concourse dedicated to domestic regional jet operations was added, a new Federal Inspection Services facility was created, and the parking structure was expanded. Plans for Terminal B also include a new international-capable north concourse for mainline and regional jet operations. Furthermore, on April 24, 2014, the Houston Airport System announced its plan to demolish and replace IAH's Terminal D starting in the first quarter of 2017. Preliminary plans for include expanding the terminal to 780,000 square feet; adding additional gates, including 15 wide-body gates necessary for larger international-bound airplanes; and adding more bathrooms, security checkpoints, and baggage systems. Terminal C North will also be demolished and remodeled as part of the renovations.
Houston's William P. Hobby Airport (HOU), commonly referred to as Houston Hobby, is located seven miles south of Downtown Houston. The airport features one main terminal, three concourses with over twenty aircraft gates, and four runways. Several major commercial airlines service the airport. In 2010, the airport completed a $250-million renovation, which included the expansion of the airport's concourse and terminal, as well as new ticket counters, a new entryway, a new baggage claim area, and general improvements to the décor of the facility. Construction is underway on a $130-million project that includes a new international terminal, a new parking garage, a new satellite central utility plant, a new concourse, and upgrades to the airport roadways. The international terminal began operations on October 15, 2015, while other renovations should be completed by early 2016.
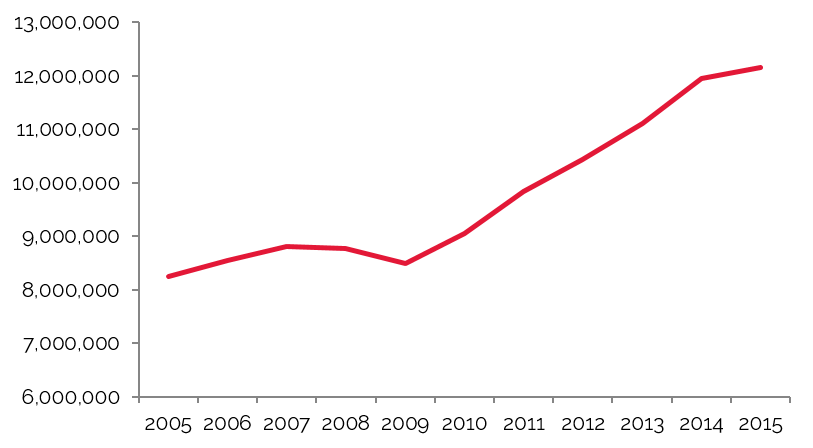
Traffic at Both Houston Airports has Grown in Recent Years
Source: George Bush Intercontinental Airport
Source: Houston Hobby Airport
Passenger traffic at George Bush Intercontinental Airport has fluctuated in the past decade, with a decrease starting in 2010 in part due to the Continental Airlines and United Airlines merger, which created routes that are more efficient. Passenger traffic began to increase in 2013, and August 2015 recorded roughly 485,953 more passengers than August 2014, a 4.1% increase. Houston Hobby Airport has realized a steady increase in passenger traffic since 2010, though 2015 data show a slowdown attributed to airport renovations. The addition of international flights at the recently opened terminal should help passenger levels regain strength. These figures, which represent a growing trend in visitation to Houston, speak indirectly to the strength of Houston’s commercial, convention, healthcare, and leisure sectors.
Tourist Attractions
Tourism to Houston peaks from February through May. During other times of the year, weekend demand comprises travelers passing through en route to other destinations, people visiting friends or relatives, and other similar weekend demand generators. The following details the city’s major tourist attractions.

The Galleria is Houston's best-known shopping destination, attracting over 24 million visitors from around the world each year. The Galleria features approximately 2.4 million square feet of retail space, making it the largest shopping mall in Texas and the eighth largest in the country. The Galleria contains more than 375 retail stores and restaurants, including major retailers such as Neiman Marcus, Nordstrom, Saks Fifth Avenue, and Macy's. The Galleria is also home to a 20,000-square-foot ice-skating facility, two Westin Hotels, three office towers, and the Galleria Tennis & Athletic Club.
NRG Stadium (formerly Reliant Stadium), the first retractable-roof, natural grass stadium in the NFL, is expected to host two mega-sporting events in the next two years: the 2016 NCAA Men's Basketball Final Four Tournament and the 2017 Super Bowl. The venue is home to both the Houston Texans and the world-famous Houston Livestock Show and Rodeo. Minute Maid Park hosts the Houston Astros baseball team, and the Toyota Center is home to the Houston Rockets. In May 2012, BBVA Compass Stadium opened near Downtown Houston; the stadium is home to Houston's professional soccer team, the Houston Dynamo.
The Houston Museum District is the fourth-largest museum district in the United States, featuring 18 world-class museums. The Menil Collection is one of the most significant art collections of the twentieth century. The Museum of Fine Arts - Houston is the largest art museum in the Southwest.
The Houston Theater District is a 17-block area located in the CBD. The district ranks second in the country for the number of theater seats in a concentrated downtown area and is home to nine performing arts organizations. The Houston Grand Opera, the Houston Symphony Orchestra, the Houston Ballet, and the Alley Theatre call Houston's theater district home, which makes the city one of only five in the country with permanent professional resident companies in all of the major performing arts disciplines.
Closing Remarks
Following years of aggressive expansion, Houston is experiencing a period of economic uncertainty, caused by plummeting oil prices and weakening demand in the energy industry. Over the last decade, the city has consistently added 100,000 residents annually, with job growth on par with residential growth. This had served as a catalyst for growth across all sectors, which only slowed with the fall in oil and gas prices. Despite lower energy prices, the city’s hotel market has fared surprisingly well in the 2015 year-to-date period. There is no doubt that Houston’s economy is increasingly diverse; it could also be, however, that the negative effects on the hotel industry have just been delayed. Nevertheless, the city’s quality of life, connectivity, and affordability are reflected in the city’s steady growth.
Hotel development, coupled with a weaker energy sector, could cut into Houston’s strong occupancy in the next two years. Yet if past trends hold true, Houston’s hotel market should recover quickly. Local developers and industry players with long-term knowledge of the city’s hotel market are confident that growing levels of demand will absorb any new supply and that the energy sector will not be down for long. As with any new project or acquisition, it will be essential for hoteliers, investors, and developers to make informed decisions, including choosing the right project and submarket relative to their hotel ambitions going forward, in order to reap the most benefits from demand generated by Houston’s growth. Still, the overall prospects for the market’s economy and hotel industry remain cautiously optimistic for 2016 and beyond.