Introduction
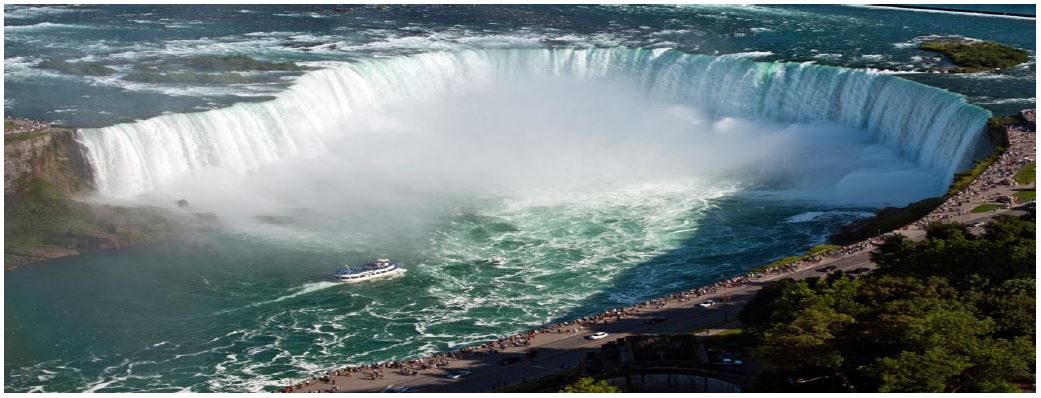
 The city of Niagara Falls, Ontario, is on the Canadian side of Niagara Falls, which forms the international border between the Canadian province of Ontario and the US state of New York. The natural wonder of Niagara Falls, which is the collective name for the Horseshoe Falls, the adjacent American Falls, and the smaller Bridal Veil Falls, is a major tourist attraction for the city of Niagara Falls, attracting 12 million visitors every year. Combined, the three falls have the highest flow rate of any waterfall in the world—and a vertical drop of more than 165 feet.
With a population of 85,810, the city offers direct "one-day" business opportunities to people on both sides of the border, along with multi-modal transportation networking that includes road, water, rail, and air. In addition to having competitive advantages for business development, Niagara Falls offers desirable industrial and commercial real estate, a vibrant arts and culture scene, an array of commercial enterprises and recreational opportunities, as well as scenic tranquility.
The following In Focus report details factors relevant to the near-term vitality of the hotel industry in the Niagara Falls area, focusing on the city of Niagara Falls and Niagara-on-the-lake, Ontario.
Hotel Market Performance and Forecast
Overview of Historical Occupancy and Rate Trends
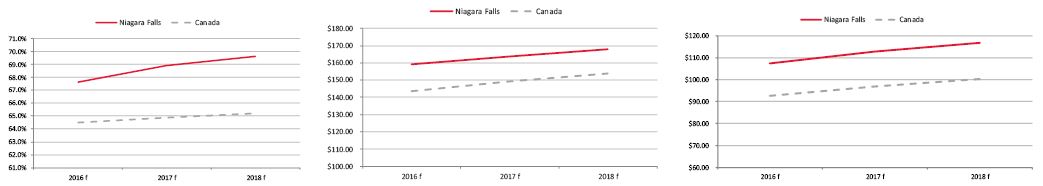
Building on the Strong Growth in Occupancy and ADR since 2013, the Outlook for the
Niagara Falls Lodging Market Remains Positive
Niagara Falls’ Occupancy and Average Rate are both expected to remain above National Average
Source: HVS
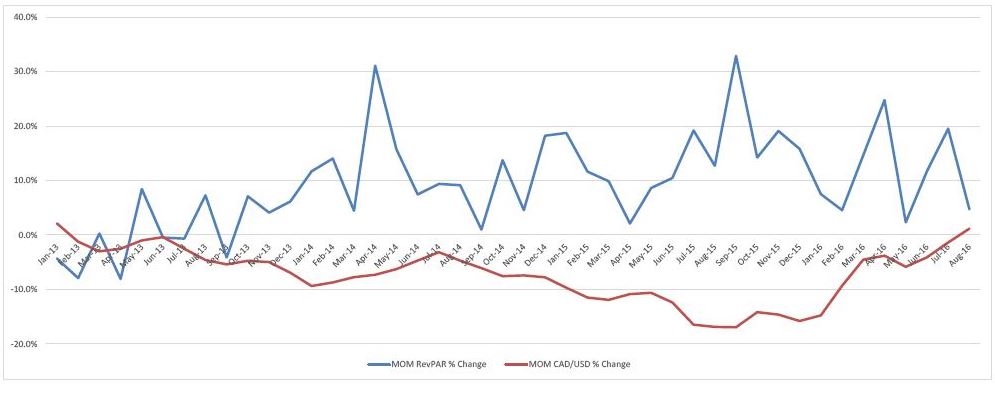
RevPAR Rises as Canadian dollar Weakens
Source: HVS
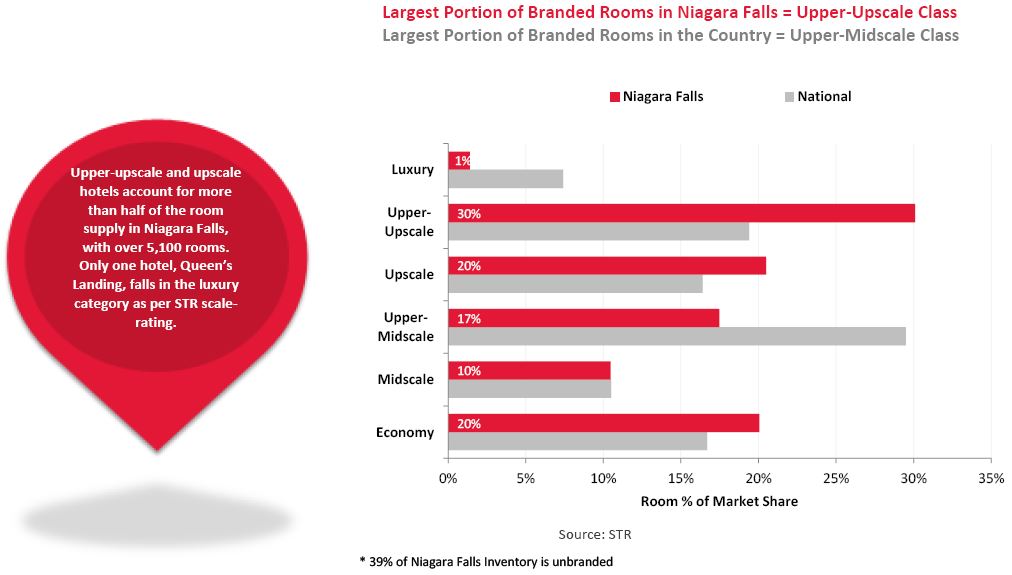
Existing Supply Breakdown by Brand and Scale
The hotels in the Niagara Falls market are primarily clustered in the vicinity of the falls, although there is another cluster of properties along Lundy’s Lane, which once served as the main entrance to the Niagara Falls area. Nevertheless, the highest-performing hotels in the area are those fronting on the falls with unobstructed views of the natural wonder. Several boutique hotels in downtown Niagara-on-the-Lake have the highest ADR in the region given their higher-end product. These properties too are not immune to the challenges of seasonal demand in the region.
New Supply Pipeline
There are several hotel development projects in the early-planning stages in the Niagara Falls market. The brands and opening dates on these projects are yet to be determined appear to be post 2018.
According to the City of Niagara Falls, there are over 25 hotel development projects that have gone through the planning process and been approved, but not moved forward. Most of the projects were proposed before 2008. Below are a couple of the most recent projects:
- The City granted approval for the Proposed Twin Hotels project on the site of the Michael’s Inn in 2012. According to the economic development office and the building department at the City of Niagara Falls, the project remains on hold.
- Approval was granted in 2012 for the Loretto Academy Conference and Banquet Centre development of three high-rise towers including hotel rooms and condominium units on 6881 Stanley Avenue. The project has yet to proceed.
Hotel Transactions
Niagara Falls
The following table details the confirmed hotel transactions that have taken place in Niagara Falls region since 2014. The trend we are seeing in the market over the three year period is more branded hotels selling at much higher per-room prices.
![]()
Source: HVS & Colliers
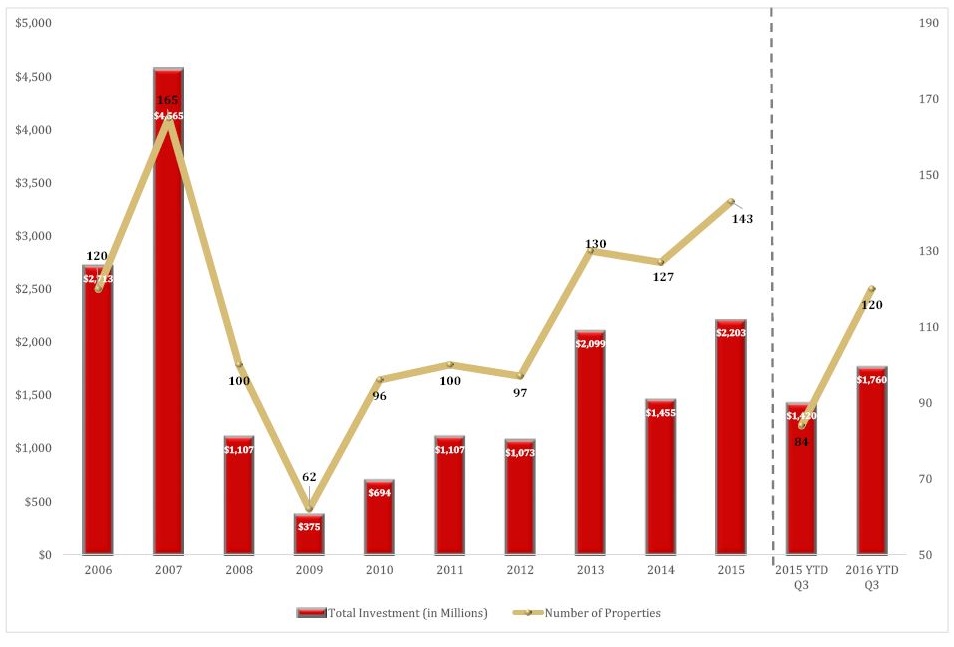
Hotel Investment in Canada (1994-2026 YTD Q3)
Source: HVS & Colliers
The cyclical nature of the hospitality investment market is evident in the sales data. Following peak levels of activity in 2006 and 2007, hotel transaction activity slowed significantly in 2008 because of the weakening economy and reduction in CMBS lending. The market came to a virtual standstill in 2009 given the financial crisis, which negatively affected the hotel and real estate industries. Transaction activity began to recover in 2010 as the economic recovery gained momentum. Driven by strong industry fundamentals and favorable investment, transaction activity continued to increase, however stalling slightly in 2014.
In Canada, the market for transactions in 2015 reached the highest level in a number of years with an increase of 51% over 2014. This growth was fueled by more transactions involving a larger number of average room count as well as greater price per room. The level was well above the historical average, exceeding the level reached in 2013, the most recent peak, which was marked by the big-ticket Westin portfolio transactions. It was however still well below the market peak in 2007, which had significant REIT activity.
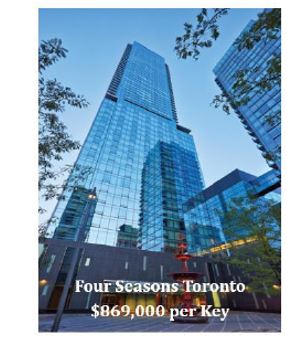
For the year-to-date Q3 data, hotel transaction volume increased by $340 million from $1.4 billion for the previous comparative period. It should be noted that in these figures we have not included the Bluesky Hotels and Resorts purchase of InnVest REIT at $2.1 billion. The Four Seasons Hotel Toronto was sold by Saudi Arabia’s Kingdom Holding Company to a U.S. based investor at $225 million which set a new price per room sale record in Canada. Foreign capital is prominent this year representing 69% of the year-to-date transactions, according the Colliers.
Trade activity has been supported by a hotel sector with good liquidity and a climate where buyers and sellers have been able to come to mutual agreement on values. Buyers were active in markets with high barriers to entry. Lenders continue to leave the door open for increased financing activity, creating a vibrant market for hotel trades in Canada.
Key Economic Indicators
Economic and Demographic Review
Population
Although there is no direct correlation between an area's population size and specific level of transient visitation, population changes are an economic trend that often reflects business activity and lodging demand. A review of an area's historical and projected population trends and composition is an important step in evaluating the local economic climate and projecting growth in demand for lodging facilities. An expanding area population suggests both an increasing commercial base and growth in room night demand attributable to relocations. In addition, an increase in the local resident base indicates a rise in the number of leisure travellers arriving in the area, as the motivation behind many trips is to visit friends and relatives. The rate of population growth will generally establish a minimum rate of increase in the lodging demand of an area.
The population of the city of Niagara Falls increased from 82,997 in 2011 to 85,810 in 2015. The area’s population is projected to grow at an average annual rate of 0.2% between 2015 and 2020, which is lower than the rate of population growth of 1.1% that is projected for both Ontario and Canada over the same period.(*Source: Superdemographics 2015)
Average Household Income
Trends in household income reflect the spending ability of local residents. According to the procedures outlined in National Income and Product Accounts, average household income is calculated by summing earned income (wages, salaries, other labour income, and proprietor's income), non-earned income, and residence adjustments for each income earner in a household. Personal contributions to social insurance are then subtracted.
The average household income for the Niagara Falls Census Subdivision (CSD) was $74,458 in 2015, which is lower than the estimated provincial average of $94,952 and the estimated national average of $89,388 for the same year.(*Source: Superdemographics 2015)
Tourist Attractions
Niagara Falls is a natural wonder that draws a substantial number of tourists into the region. Many attractions have been developed in the area overlooking the falls to capitalize on the visitors that are drawn to see the most powerful waterfall in North America, including souvenir shops, the Fallsview Casino & Resort, the Niagara Botanical Gardens, the Niagara SkyWheel, and the Skylon Tower, which offers a spectacular view of the falls.
The boat tour of the falls is also a major attraction for the city. Hornblower Cruises replaced the legendary Maid of the Mist in 2014 with newer catamarans that can carry 700 passengers. The 30-minute tour gives visitors a spectacular close-up view of the American and Horseshoe Falls, as well as the occasional celebrity. Visitors can also enjoy the Journey Behind the Falls, which allows visitors to view the falls from observation decks behind the falls.
On Clifton Hill, a major tourist promenade, visitors can choose to eat at a variety of restaurants, including Boston Pizza, Kelsey’s Niagara, the Rainforest Café, and Mama Mia’s. Clifton Hill also features an array of attractions, such as the Niagara SkyWheel, the Great Canadian Midway Arcade, the Movieland Wax Museum of Stars, and the Ripley’s Believe it or not Museum. A multi-million project is currently taking place on Clifton Hill, which will be discussed in detail in the following section.
The region is also appealing to residents of nearby cities—and the Greater Toronto Area (GTA) in particular—for weekend getaways. As such, the region is home to numerous quality restaurants, wineries and breweries, and spa facilities. Recreational activities, including bicycle tours and hot air balloon rides, also attract people from the surrounding area. Niagara-on-the-Lake, located about 22 kilometres north of the city, is a popular tourism destination for its wineries, heritage sites, galleries, and boutiques. Niagara-on-the-Lake often cannot accommodate the peak demand during the summer months, thus tourists often combine the destination with Niagara Falls and stay overnight in Niagara Falls with its greater inventory of rooms.
Major Projects
New developments are taking place within the Niagara region that may have an impact on hotel demand:
- Recently completed, the first phase of a multi-phase revitalization project along Victoria Avenue had a total budget of $3.8 million. The City recently announced the approval of $365,000 for engineering design work related to the second phase, and construction cost estimates are being prepared and set to be announced next year. The multi-phase project aims to improve overall accessibility and road conditions.
- The new headquarters for the Niagara Regional Police opened in September 2016 on a site located at the intersection of Highway 420, Portage Road, and Valley Way. The 210,000-square-foot project cost $65 million to develop. The new headquarters is expected to house 600 police and civilian staff.
- A $50-million, 12-storey condominium project is expected to be built by 2018. The site is on McLeod Road, between Pin Oak Drive and Kalar Road, approximately six kilometres southwest of the subject property.
- A $100-million condominium project is currently in the pipeline for a site located near the Thundering Waters Golf Course in Niagara Falls, approximately four kilometres south of the subject property. The developer expects construction to start in 2017, with occupancy scheduled for 2018. Sixty of the 150 units had already been sold as of Q3 2016. This project is distinct from the potential $1-billion development for the Thundering Waters area that is discussed below.
- There is a $1-billion project in the Thundering Waters area, that has yet to be approved. The project covers 196 hectares located approximately three kilometres southwest of the subject site. The plan calls for multiple residential, commercial, institutional, and employment developments for 115 hectares of the land. City Council currently has the proposal under review. Were it to move forward, the development would have a positive effect on the local economy. Given the uncertain nature of the project, we have not taken this development into consideration in our forecasts of future demand growth for the market.
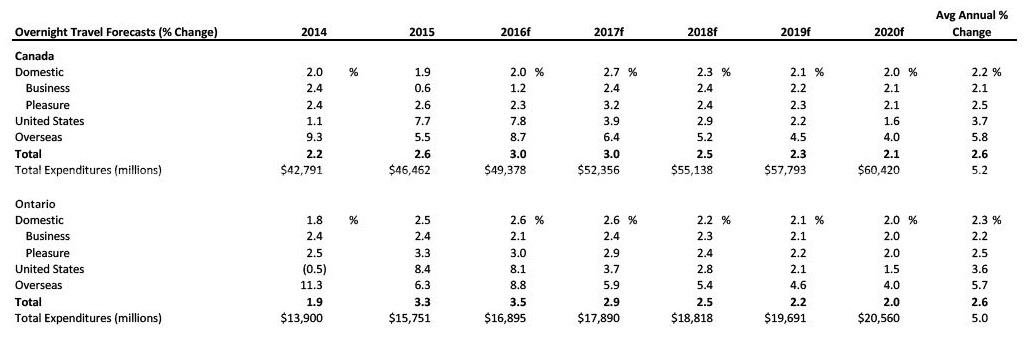
Travel Market Intentions – National and Provincial
Travel market intentions are a strong indicator of lodging demand in Canada. The trend data compiled by the Conference Board of Canada and the Canadian Tourism Research Council show changes in overnight travel within both provincial and metropolitan markets. The data are then segmented according to traveller type and origin. The changes that occur in overnight travel have a direct relationship with specific types of lodging demand in Ontario.
Strong Growth in Overseas Visitation Expected for Canada and Ontario through 2019
Source: Conference Board of Canada Travel Market Outlook
In 2015, the total number of overnight visits to the country exceeded 134 million, representing an increase of 2.6% over the previous year. US visitors accounted for the largest increase; visitation was up an estimated 7.7% in this segment, reaching over 13 million overnight stays. This strong growth can be attributed to the weak Canadian dollar and low fuel prices.
Lower fuel prices also played a role in the 1.9% increase in domestic overnight visitation that is estimated to have taken place in 2015. Growth within this segment is significant since domestic overnight visits also accounted for more than 84% of total overnight visits in 2015. Domestic leisure visitation is estimated to have increased 2.6% in 2015. Given the better value for money with the low Canadian dollar, Canadian destinations more attractive for both domestic and foreign travellers. However, slumping oil prices suppressed the growth in domestic business overnights, which are estimated to have grown only 0.6% in 2015.
Altogether, total expenditures on overnight visits in the country amounted to an estimated $46.5 billion in 2015. Although the overall performance for the country as a whole was fairly strong, 2015 was marked by great variation in regional performances; oil-producing provinces fared worse than provinces with more diversified economies and export sectors.
The weak Canadian dollar and relatively stable Canadian economy will support the growth in domestic overnights through 2019. This segment is projected to grow annually between 2.0% and 2.7% per year through this period, held in check by household and businesses financial concerns. Within this segment, domestic business travel is projected to increase 1.2% and 2.4% in 2016 and 2017, respectively.
At the same time, the depreciated Canadian dollar, the strengthened US economy will support further gains in visitation from the US, albeit at a less robust rate than in 2015. Likewise, increased air capacity, particularly from European countries, will support strong growth in overseas visitation, which will nonetheless taper because emerging economies are struggling as a result of low commodity prices and the slowdown in China.
In descending order of size, the largest sources of the increase in overnight visitation to Canada in 2016 are expected to be India, China, Mexico, and the United Kingdom. Over the four-year forecast, travel expenditures are expected to grow at a strong annual growth at 5.2% as travel prices increase.
Overnight visitation in Ontario is estimated to have increased at a healthier rate of 3.3% in 2015 following the modest growth of 1.9% posted in 2014. The weakened Canadian dollar and lower gas prices created a surge in visitation from the US, and an increase in air capacity at Pearson Airport contributed to a robust boost in overseas visitation, especially in the number of travellers from Asian markets. The province played host to a number of sporting events 2015, including the Pan Am and Parapan Am Games, the IIHF World Junior Championships, and the FIFA Women's World Cup, which contributed to the solid 2.5% growth in domestic visitation estimated for 2015.
Ontario is expected to see slow, steady growth in the number of domestic business and pleasure travellers over the next four years. Strong growth in overseas visitation is expected to persist through 2019, while the rate of growth in visitation from the United States is expected to taper off after 2017.
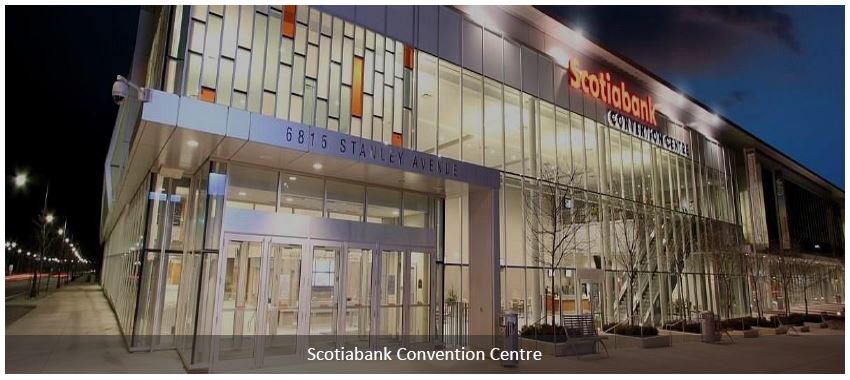
Convention Activity
A convention centre generates significant levels of demand for area hotels, particularly those within a radius of three miles. Convention headquarters hotels command premium rates and, in addition to capturing event-related demand, can also benefit from hosting related banquet events. Major conventions also push demand to peripheral hotels in the market.
Located in Niagara Falls, the Scotiabank Convention Centre, which opened in April 2011, features approximately 228,000 square feet of meeting space, including state-of-the-art conference facilities, 18 meeting rooms, and an 81,000-square-foot exhibition hall. The major events scheduled to take place in 2017 include the Star Beat Dance Champion 2017, the Greater Niagara Home and Garden Show 2017, the Niagara Falls Comic Con, the CAS Annual Conference & Tradeshow, the Niagara Icewine Festival, and the Canadian Wireless Telecommunication Association 2017 Conference & Exhibition.
Airport Traffic
Airport passenger counts are important indicators of lodging demand. Depending on the type of service provided by a particular airfield, a sizable percentage of arriving passengers may require hotel accommodations. Trends showing changes in passenger counts also reflect local business activity and the overall economic health of the area. The Niagara Falls market is served by two major airports, the Toronto Pearson International Airport in the Canadian side, and the Buffalo Niagara International Airport in the US side.
Toronto Pearson International Airport
Located over 130 kilometres northwest of the city, Toronto Pearson International Airport, the largest and busiest airport in Canada, serves the city of Niagara Falls. The airport has three terminals and is currently undergoing a $4.4 billion redevelopment program (the GTAA’s Terminal Development Project) intended to allow the airport to meet the growing air transportation needs of the Greater Toronto Area. The project will replace Terminals 1 and 2 with a single unified terminal, which, with Terminal 3, will allow the airport to process up to 50 million passengers a year by 2020.
In 2014 and 2015, passenger traffic through Toronto Pearson increased by 6.8% and 6.4%, respectively, or approximately 2.5 million passengers growth each year. Increased commercial activity, the Pan Am and Para Pan Am Games, the intensification of tourism resulting from the low Canadian dollar, and the addition of new international air carriers contributed to the rise in passenger traffic through the airport in 2015, marking a record-breaking year. The year-to-date data show a continuation of this strong growth.
Passenger Traffic through Toronto Pearson Expected to Reach New Records in 2016
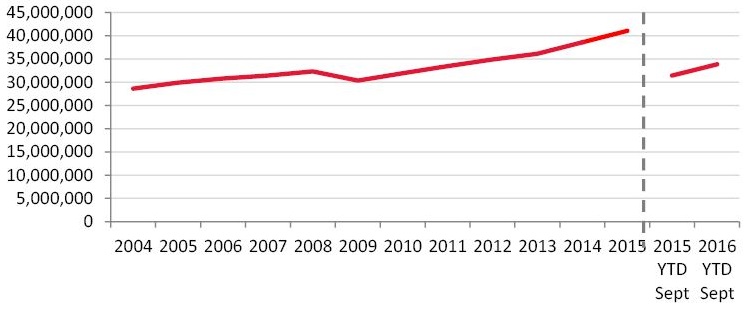
Source: Toronto Pearson International Airport
The Buffalo Niagara International Airport
Located approximately 40 kilometres southeast of the city, The Buffalo Niagara International Airport serves Buffalo, New York, and Southern Ontario, Canada. Many commercial and regional carriers service the airport. Since its opening, the airport has expanded both the east and west ends of the concourse facility, now featuring 25 gates.
The passenger traffic through the airport decreased after its peak in 2008 due to the recent recession when US national passenger traffic experienced a sharp decline. The passenger traffic hovered above 5 million from 2010 to 2013. In 2014, however, passenger traffic dropped below 5 million, largely due to the reductions in daily flights, following the merger of Southwest Airlines and AirTran and the merger of US Airways and American Airlines. The Southwest merger resulted in fewer daily flights between Buffalo and Atlanta, and US Airways has dropped seven of its weekly flights to Washington Dulles in the first half of 2014. The 6.8% decrease of passenger traffic recorded in 2015 can be attributed in large part to the weakened Canadian dollar, which discouraged Canadians from flying out of US border airports.
Passenger Traffic through Buffalo Niagara International Airport Continues to
Drop from the Peak in 2008
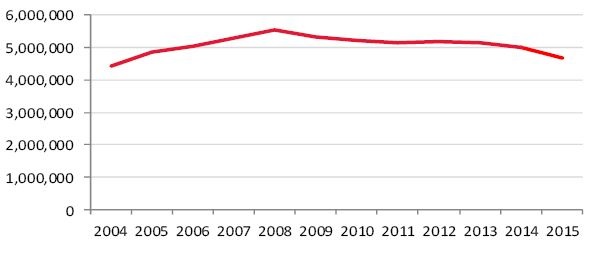
Source: Buffalo Niagara International Airport
Closing Remarks
The Niagara Falls area is experiencing a period of economic strengthening and expansion, led primarily by the tourism industry. The weakened Canadian dollar has stimulated an increase in the number of overnight visitors from the US and overseas, and with the growth in visitation has come a rise in visitor expenditures. At the same time, strategic enhancements to the city’s infrastructure are supporting the growth in the local tourism industry and the Niagara Falls regional economy more generally. As the hotel industry in Niagara Falls is largely dependent on local tourism, market-wide demand has soared over the past two years. Limited immediate new hotel supply is planned for the Niagara Falls regional market, which should allow the hotel market to capitalize on the steady increase in demand that is expected to persist through the near term, and result in continued growth in RevPAR.