

INTRODUCTION
In 2023, the national lodging market continued to achieve high performance levels. While occupancy growth was minimal, compared to the level achieved in 2022, average daily rate (ADR) and revenue per available room (RevPAR) reached all-time highs. This robust performance reflects a strong recovery and growth trajectory following the disruptions caused by the COVID-19 pandemic. Data for 2024 illustrate that the hotel industry has continued to experience minimal improvements in key performance metrics. Despite occupancy remaining relatively flat, both ADR and RevPAR have shown continued growth thus far this year. These healthy metrics typically create a supportive environment for new hotel construction; however, the elevated costs of debt and capital compared to previous years have been a significant deterrent, effectively slowing down construction activity.While the market is generally thriving in terms of topline operational metrics, elevated construction costs as well as the increased cost of financing new projects has led to a slowdown in the pace of new hotel developments. High interest rates and stringent lending conditions are challenges for developers trying to push new projects through the pipeline. Thus, supply growth moderated in 2023 and is only expected to increase minimally over the next few years as the economy continues to normalize.
HVS has tracked hotel development costs for over three decades, collecting data from actual hotel cost budgets during our assignments. This 2024 survey reports per-room hotel development costs based on data compiled by HVS from hotel projects proposed or under construction during the 2023 calendar year. The data reflect eight product categories: limited-service, midscale extended-stay, upscale extended-stay, dual-branded, select-service, full-service, and luxury hotels, as well as redevelopment projects. Given that this survey provides a retrospective view, inflationary factors that continued through 2023 and the year-to-date 2024 period may not be fully reflected in the data.
The HVS U.S. Hotel Development Cost Survey sets forth averages of development costs in each defined lodging product category. The survey is not meant to be a comparative tool to calculate year-to-year changes, but rather, it reflects the actual cost of building hotels across the United States in 2023. As will be discussed, the medians and averages set forth in this survey are greatly affected by the types and locations of hotels being developed at this point in the economic cycle. Our goal in sharing this publication is to provide a basis for developers, investors, consultants, and other market participants to evaluate hotel development projects. Given that development costs for hotels are dependent on a multitude of factors unique to each development and location, this report should not be relied upon to determine the cost of actual hotel projects or for valuation purposes. Instead, it is intended to provide support for preliminary cost estimates, as well as to show a comparison across the various hotel categories.
SUPPLY-AND-DEMAND DYNAMICS AFFECTING HOTEL DEVELOPMENT
In 2023, hotel occupancy remained fairly stable, while ADR exceeded previous levels. STR reported national year-end 2023 occupancy and ADR at 63.0% and $155.62, respectively. In the year-to-date period through June 2024, the metrics were reported at 62.6% and $157.50, respectively, equating to a 0.4% decline in occupancy and a 1.8% increase in ADR when compared to the same period in 2023. Meanwhile, RevPAR was up 1.4%, compared to the same period in 2023, highlighting the industry's ability to generate higher revenues and adapt to post-pandemic conditions.EXHIBIT 1: U.S. ADR & REVPAR REACH ALL-TIME HIGHS IN RECENT YEARS, BUT OCCUPANCY STILL RECOVERING
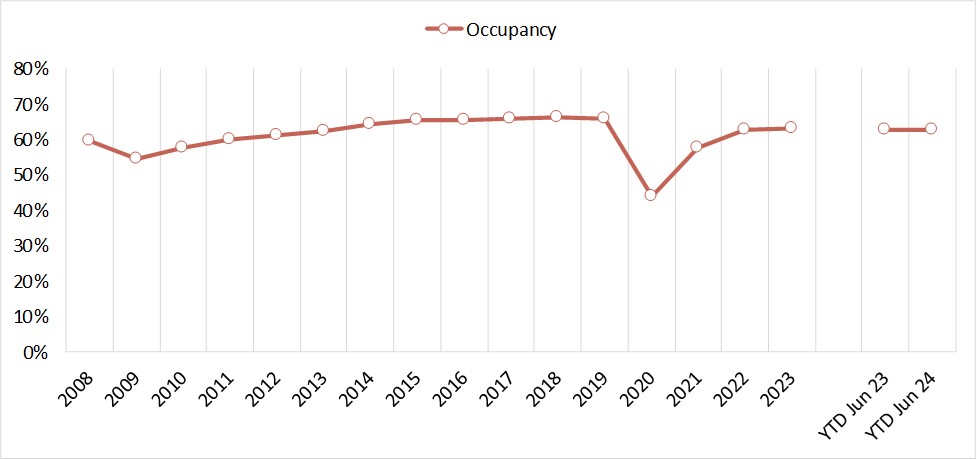
Source: STR
The travel market landscape in the United States is undergoing significant rebalancing in the post-pandemic era. While RevPAR, a key performance metric in the hotel industry, is up slightly on a nationwide scale, the growth has not been shared equally. Thus, while some markets are improving, others are stabilizing or declining, balancing out the overall performance.
Many leisure-oriented markets, which were the first to bounce back after the pandemic, are now experiencing a correction, with some resort destinations showing flat or declining performance as the initial surge in demand is now tapering off. The moderation in leisure market performance is partly due to an increase in outbound international travel, as more Americans opt for overseas vacations. At the same time, inbound international travel to the United States remains below pre-pandemic levels, further influencing these trends. Urban destinations, which suffered more during the pandemic because of group restrictions and reduced business travel, are now experiencing a stronger recovery, primarily driven by an increase in group demand.
To further illustrate this point, primary markets, which represent the top 25 cities in the United States, experienced an 8.3% increase in RevPAR in 2023, compared to 2022, and 2.5% RevPAR growth in the year-to-date 2024 period. In contrast, all other markets experienced more modest RevPAR growth of 2.2% in 2023 and 0.4% in the year-to-date 2024 period, demonstrating the stronger recovery of the larger markets in the last 18 months.
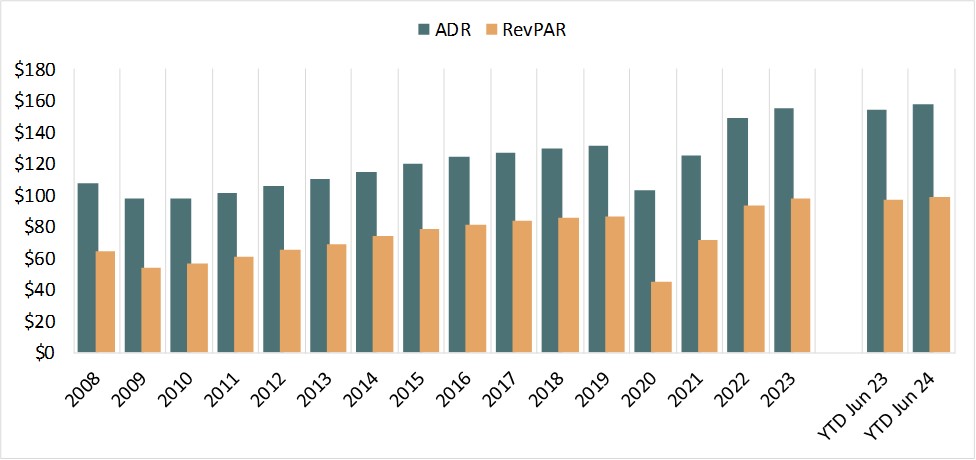
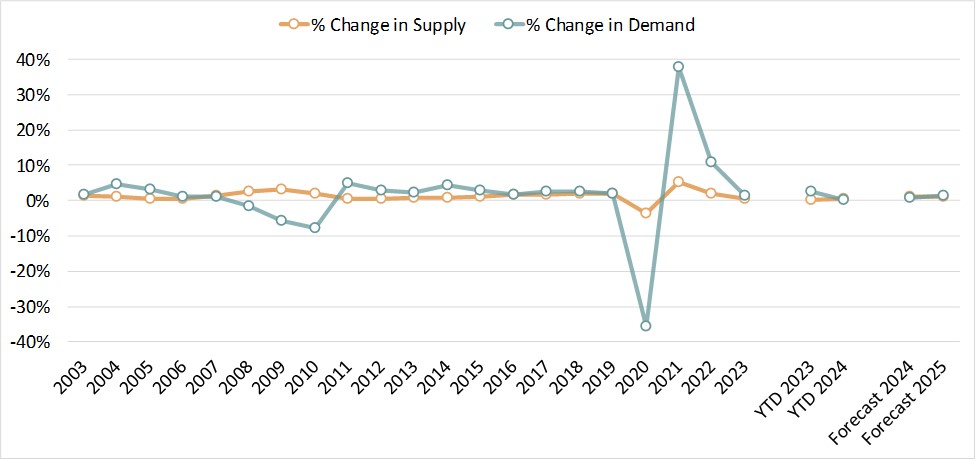
Supply growth typically lags the market because of the time it takes for projects to become feasible, obtain financing, and be developed. Growth in new supply following the 2009 economic downturn slowed substantially to an annual average of 0.4% from 2011 through 2013. In the early post-recession years, hotel revenue, net operating income (NOI), and values declined to levels that did not support new construction. Once RevPAR and NOI reached a point supporting feasibility, it took several years for projects to obtain financing and be constructed. The pace of supply growth more than tripled from that trough to an average of 1.4% from 2014 through 2019, reflecting the resurgence of hotel openings in those years, as illustrated below.
EXHIBIT 2: NATIONWIDE SUPPLY GROWTH SLOWS
Source: STR (Historical), HVS (Forecast)
Total supply decreased by 3.9% in 2020, attributed largely to the hotel closures resulting from travel restrictions imposed during the pandemic. In 2021 and 2022, national supply grew significantly; in addition to the reopening of many closed hotels, most hotel development projects completed during those years had been planned in or before 2019/20. However, in 2023, the addition of new supply slowed to 0.5%. This slowdown was due to a combination of supply chain issues, increasing construction costs, and the rising cost of debt, which hindered new hotel development in the post-COVID years. Going forward, supply increases will likely continue to be challenged by these factors and the relatively lackluster performance of some markets, as evidenced in the 2024 forecast, where supply is anticipated to grow by only 0.75%.
Based on available data from STR, the following table illustrates historical supply-growth data, coupled with our forecasts for 2024 through 2028.
EXHIBIT 3: U.S. HOTEL SUPPLY EXPECTED TO GROW THROUGH 2028
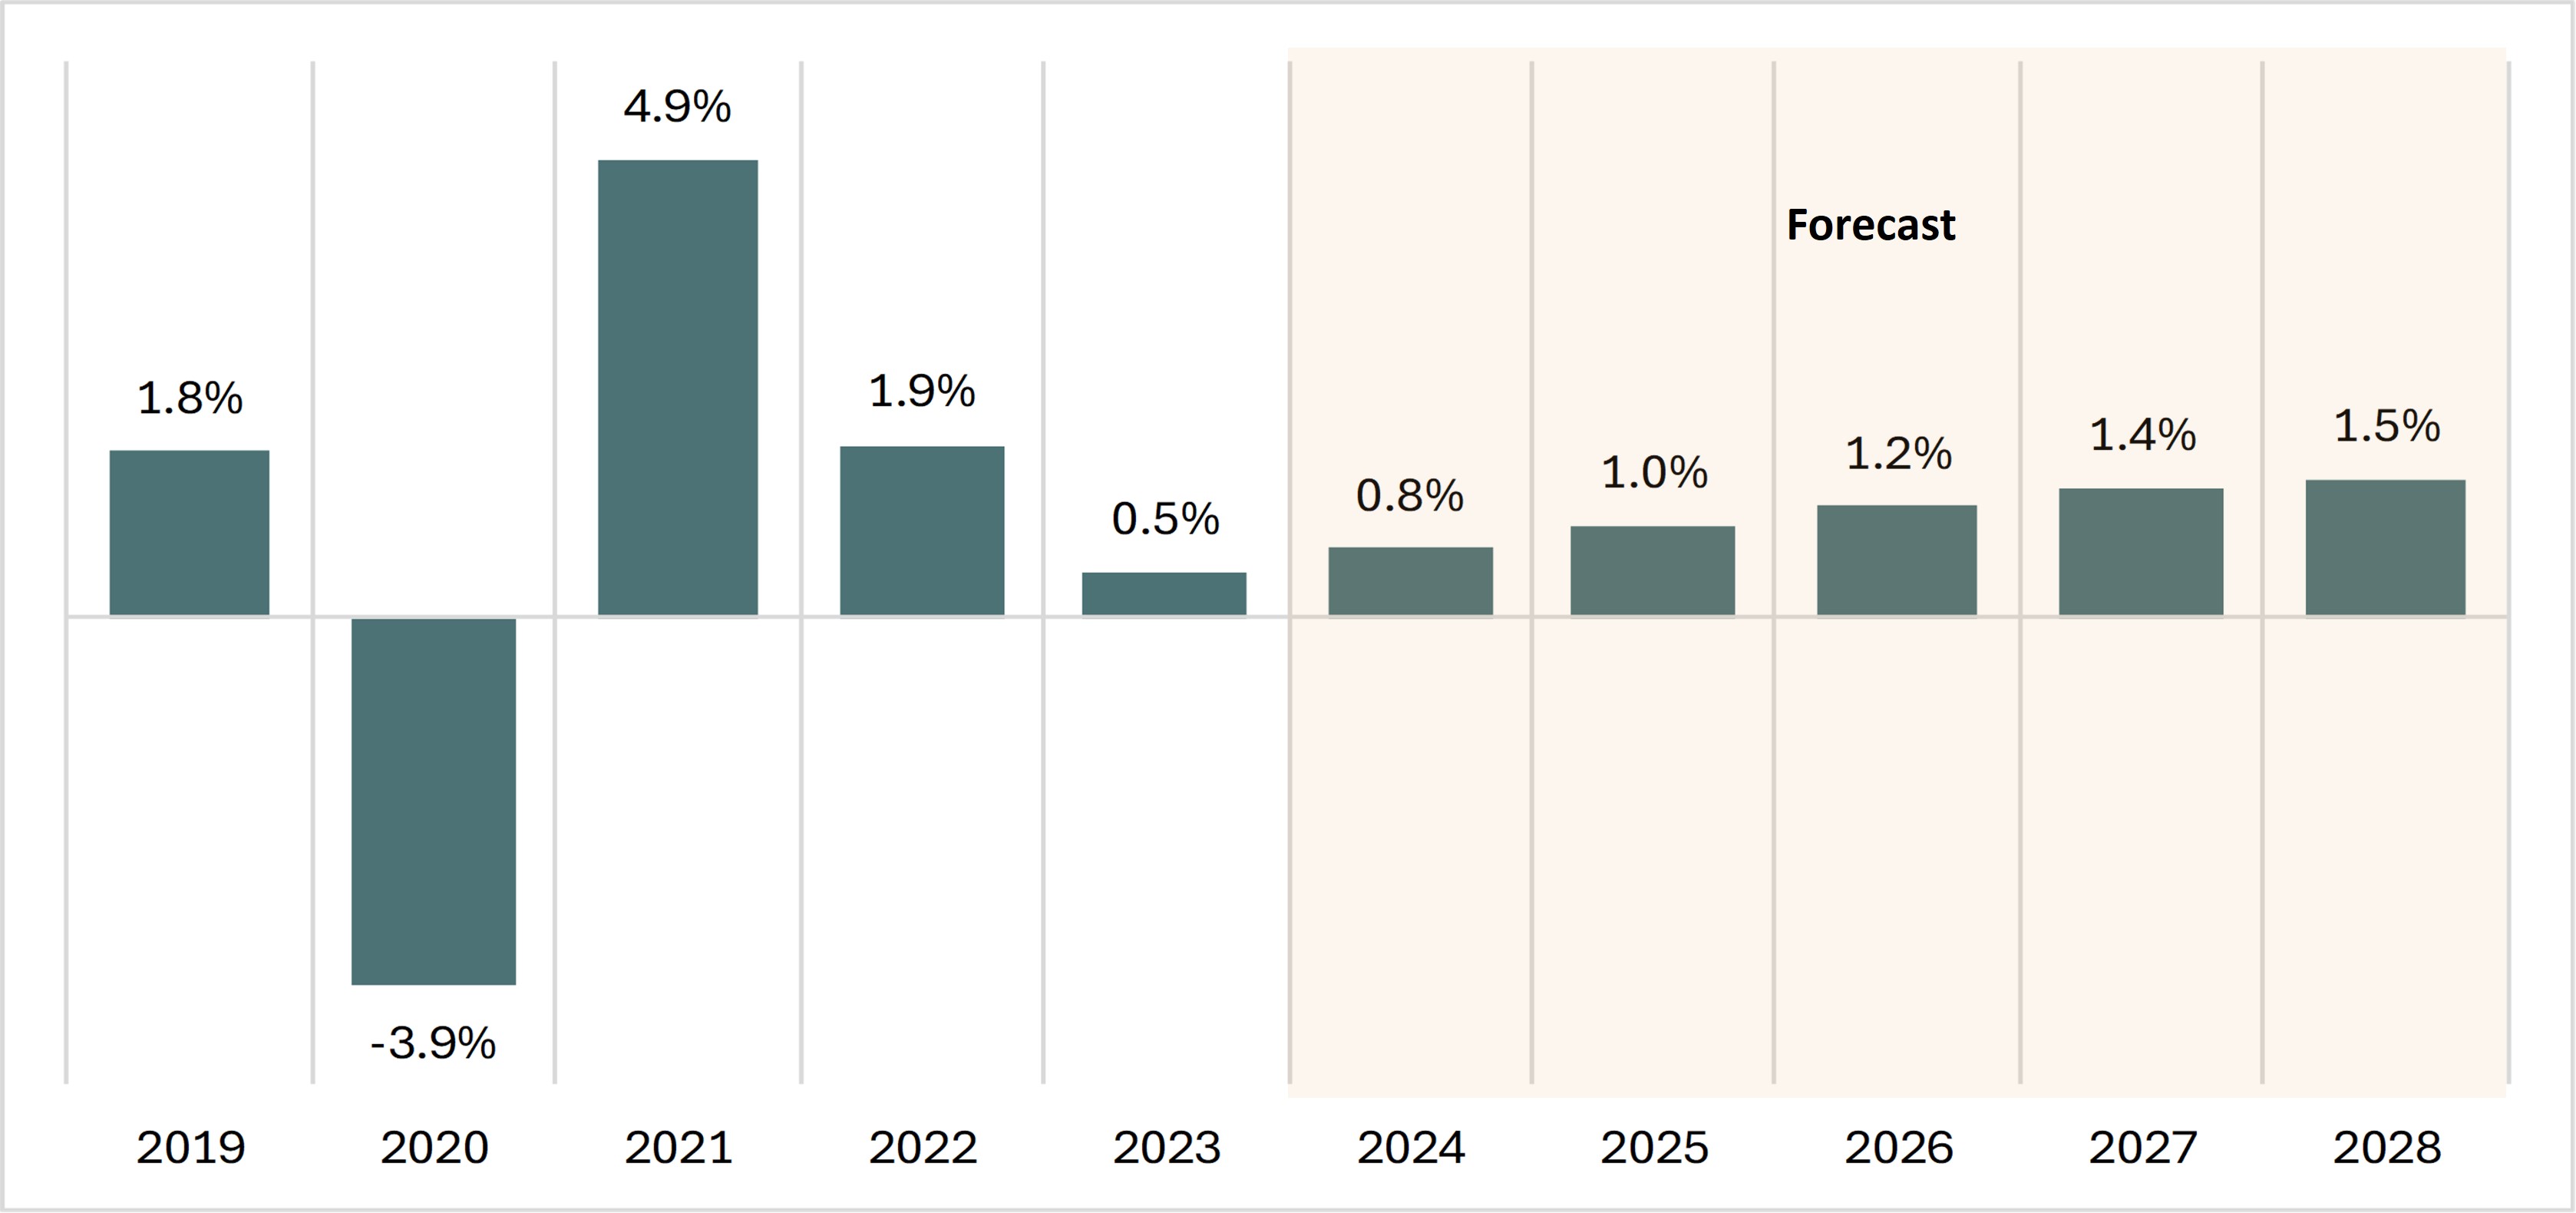
Source: STR (Historical), HVS (Forecast)
While high construction costs and the high cost of capital pose challenges for new hotel development, these periods may also present opportunity. Higher borrowing costs reduce the overall return on investment, making some projects financially unfeasible. Developers may struggle to secure loans or face unfavorable loan terms, which can delay or halt the progress of new developments. Despite these challenges, this could be an advantageous period for initiating the lengthy pre-development process, which may involve market/feasibility studies, entitlement efforts, architectural and design planning, brand/operator searches/negotiations, and pre-construction work. Economic downturns and high costs discourage some developers from starting new projects, reducing competition. This can provide an opportunity for those who proceed with development to capture market share once conditions inevitably improve.
CONSTRUCTION COST INFLATION
In terms of inflation specifically related to development costs, we present historical information below from the Turner Building Cost Index, which has tracked costs in the non-residential building construction market in the United States since 1967. The Turner Building Cost Index is determined by the following factors on a nationwide basis: labor rates and productivity, material prices, and the competitive condition of the marketplace. The index generally increased year-over-year from 2011 through 2019, significantly outpacing inflation from 2013 through 2019. The index grew by 5.0% on average from 2014 through 2019, before slowing to 1.8% growth in 2020 and 1.9% growth in 2021; however, the cost index surged by 8.0% in 2022, followed by a 6.0% increase in 2023. Growth of the index fell again to 4.0% in the 2023/24 trailing-twelve-month (TTM) period ending June 2024.As an additional point of reference, Rider Levett Bucknall (RLB), which also compiles a quarterly construction cost report, also reported a construction cost index increase of 6.1% for year-end 2023.
The annual changes in the Turner Construction Cost Index compared with the annual changes in the Consumer Price Index (CPI) are illustrated in the following graph.
EXHIBIT 4: COMPARATIVE VIEW OF CONSUMER PRICE INDEX VS. TURNER COST INDEX CHANGES
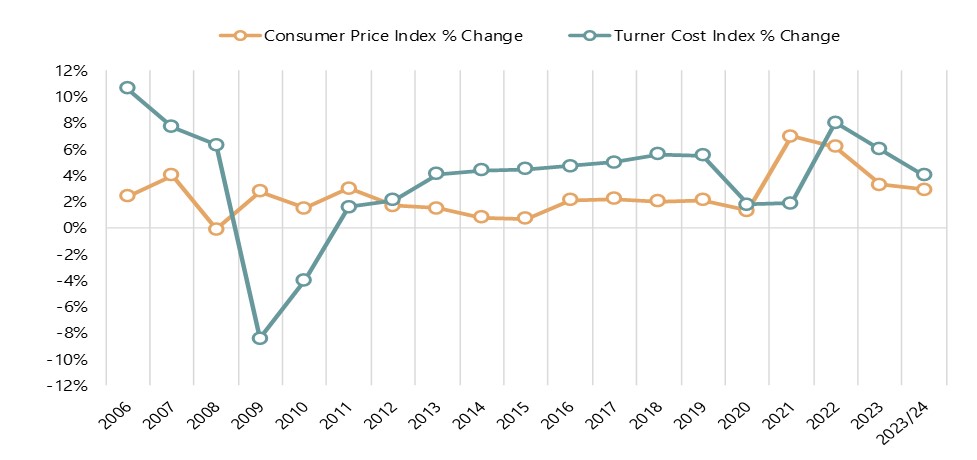
Source: U.S. Bureau of Labor Statistics, Turner Building Cost Index
In recent years, the construction industry has experienced notable fluctuations in costs. However, as we move further into 2024, the landscape is shifting, with cost inflation aligning more closely with the CPI. This trend suggests a favorable environment for new developments to gain momentum. The latest data from Turner Building Cost Index indicate that cost inflation is now around 4.0%, reflecting a significant decline from the previously heightened rates.
Several factors have contributed to the reduction in cost inflation. First, the labor market has stabilized. During the height of the COVID-19 pandemic, labor shortages were rampant due to illness, movement restrictions, and safety concerns. The scarcity of workers led to increased wages and overtime expenses as companies competed to attract and retain labor; however, the workforce has now returned to more normal levels, mitigating these pressures. Additionally, the supply-chain disruptions that plagued the industry are now easing. During the pandemic, factory closures, lockdown measures, and transportation restrictions caused delays and material shortages, driving up prices. Today, these logistical challenges have largely been resolved, leading to more predictable and stable material costs. The competitive landscape of the construction industry is also normalizing. Post pandemic, there was a rush to resume delayed projects, leading to increased competition, higher bidding prices, and inflated budgets. As the backlog of projects has now been addressed, the market is reaching equilibrium, which is reflected in more stable and predictable project costs. This stabilization in costs opens the door for new developments to proceed with greater financial confidence in markets where the fundamentals support new supply.
HOTEL DEVELOPMENT COST CATEGORIES
Evaluating the comprehensiveness of a hotel development budget can often be challenging, as different line items are used, and some components are unintentionally omitted. HVS has been at the forefront of helping developers and industry participants make sense of hotel development costs through the consistent presentation of these costs. Based on our experience reviewing actual developers’ budgets, as well as preparing the annual HVS U.S. Hotel Development Cost Survey, we have created the following summary format for hotel development budgets, which forms the basis for the presented cost categories. We find that these categories are meaningful for hotel professionals when undertaking an analysis related to hotel feasibility, and they provide a basis from which to analyze proposed projects. The following illustration shows the six categories defined by HVS, as well as the typical items associated with each category.EXHIBIT 5: HVS HOTEL DEVELOPMENT COST CATEGORIES
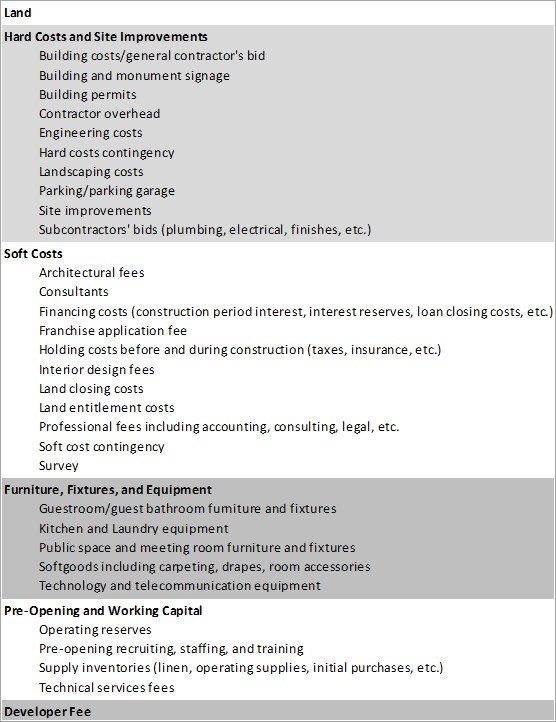 Source: HVS
The categories are not meant to be all encompassing but do reflect the typical items in a development budget. In construction accounting, development budgets are commonly presented in far greater detail than they are in general investment analysis.
DATA COLLECTION AND SAMPLE SIZE
HVS collected actual hotel construction budget data nationwide in 2023. While not every construction budget was captured (for a variety of reasons, including incomplete data, skewed data, or development attributes), our selection includes complete and reliable budgets that form the basis for this year’s survey. The budgets included both ground-up development projects and redevelopments of existing buildings throughout the United States. This year, the states most represented in the survey were Florida, California, Texas, Arizona, Colorado, North Carolina, New York, Georgia, and Arkansas, illustrating where the bulk of hotel development is occurring in the country. Furthermore, as would be expected, construction costs varied greatly in different parts of the country. In this sample, the highest construction costs on a per-room basis remained in markets with high costs of living—primarily California, followed by New York; however, a number of high-end luxury developments were also noted throughout the country. Developments with the lowest costs per room included limited-service or economy extended-stay hotels in the “Sun Belt” states.We also examined the lodging product-tier breakdown of our data to further determine the most popular types and brands of hotels that were developed in 2023. In the limited-service category, the top five brands were Hampton by Hilton, Tru by Hilton, Holiday Inn Express, Fairfield by Marriott, and La Quinta by Wyndham. Within the extended-stay category, the top six brands were Home2 Suites by Hilton, WoodSpring Suites, TownePlace Suites by Marriott, Element by Westin, Residence Inn by Marriott, and Homewood Suites by Hilton. The select-service segment was most represented by brands such as Courtyard by Marriott, Hilton Garden Inn, EVEN Hotels, Hyatt Place, and Aloft Hotels. Lastly, the full-service category was represented by a variety of “collection” brands from Marriott, Hilton, and Hyatt, as well as a number of independent or unbranded projects at the time of the study.
PER-ROOM HOTEL DEVELOPMENT COSTS
The averages and medians below reflect a broad range of development projects across the United States, including projects in areas with low barriers to entry and those in high-priced urban and resort destinations.EXHIBIT 6: MEDIAN HOTEL DEVELOPMENT COSTS ROSE 3% SINCE LAST SURVEY
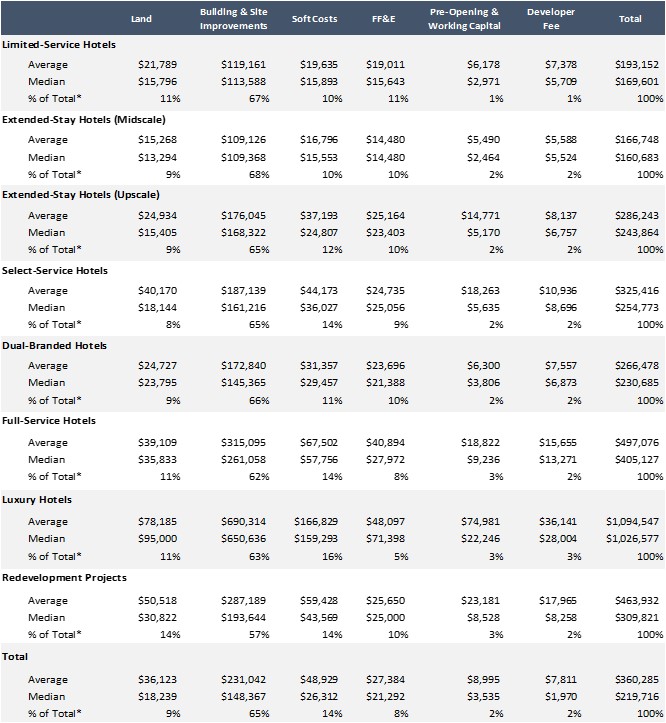 *The percentage of total is calculated based on the total sample of all budgets.
Source: HVS
Source: HVS
Limited-service and midscale extended-stay hotels illustrated median per-room costs in the $160,000 to $170,000 range and included the popular brands previously highlighted. The median cost for hotels in the upscale extended-stay and select-service categories was around $250,000 per room. Dual-branded hotels showed a median cost of $231,000, as this category often includes an extended-stay midscale or upscale brand paired with either a select-service brand or a limited-service brand.
The cost to develop full-service hotels is approximately $150,000 per room higher than select-service hotels, with a median cost of over $400,000 per room. Lastly, the median cost to develop luxury hotels was recorded at over $1,000,000 per room. This category reflected the lowest number of developments, considering the mathematics of making luxury projects feasible given the high development costs across the nation.
It is important to note that the median cost for all hotels increased 3.0% when compared to the results of our last survey.
IN CONCLUSION
The budgets analyzed in this survey were provided directly by the developers, owners, and lenders on both ground-up and conversion hotel projects during the illustrated period. The results of the survey combine the data from actual construction budgets organized across a variety of product types. The results also comprise unique hotel projects that cannot be replicated by the inherent nature of hotel development. As such, we would caution developers against relying on the information to estimate costs for a specific project, as a multitude of factors affect a hotel’s development budget. Thus, we recommend that users of the HVS U.S. Hotel Development Cost Survey consider the per-room amount in the individual cost categories only as a general guide for that category.Construction and FF&E design and procurement firms are the best sources for obtaining hard costs and FF&E costs for a specific hotel project. It is also advised that developers consult more than one source in their hotel development process to more accurately assess the true cost of development. Additionally, the cost should always be adjusted for inflation over the development timeline given that the typical hotel development process can last three to five years. Lastly, we recommend that the projected performance of the proposed hotel be revisited periodically during the development process.
HVS is available to assist owners and developers in all aspects of the hotel development and ownership life cycle, from initial idea through development, opening, and beyond. For further information, please contact Luigi Major at (310) 270-3240 or [email protected].
About Luigi Major, MAI
0 Comments
Success
It will be displayed once approved by an administrator.
Thank you.
Error