Steady, paced growth describes Phoenix’s current economic trajectory, which has lagged the nation’s post-recession recovery in terms of job growth, population growth, and housing trends. The protracted recovery of the Phoenix Metropolitan Statistical Area, which comprises both Maricopa and Pinal Counties, has been buoyed by growth in company expansions, infrastructure improvements, and increased tourism demand. Rising demand and occupancy have driven the recovery, with improvements in average daily rate lagging the cycle.
Hotel Market Performance and Forecast
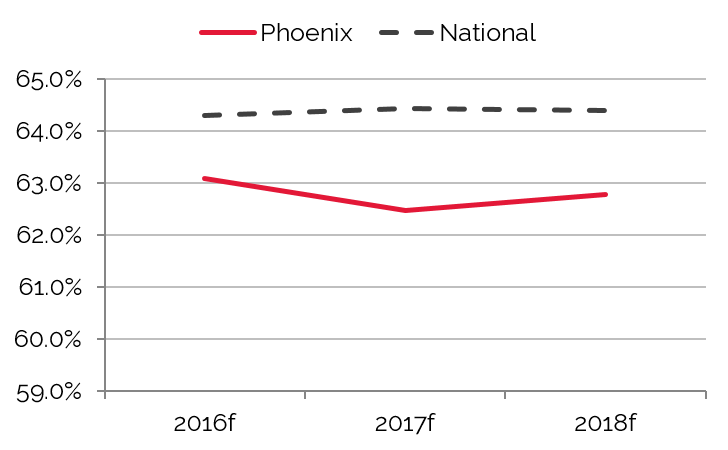
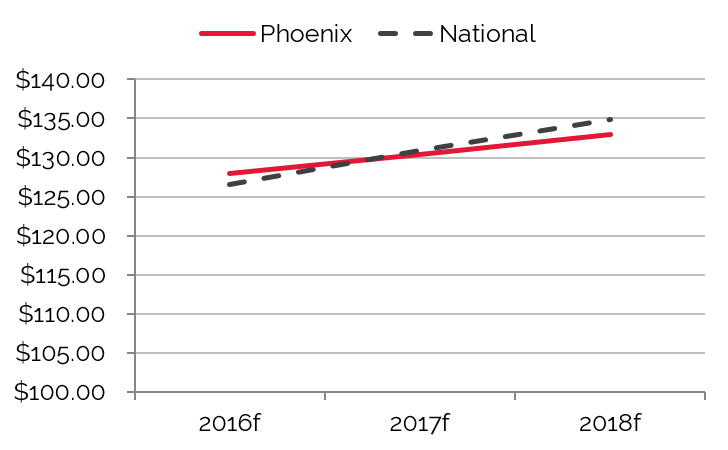
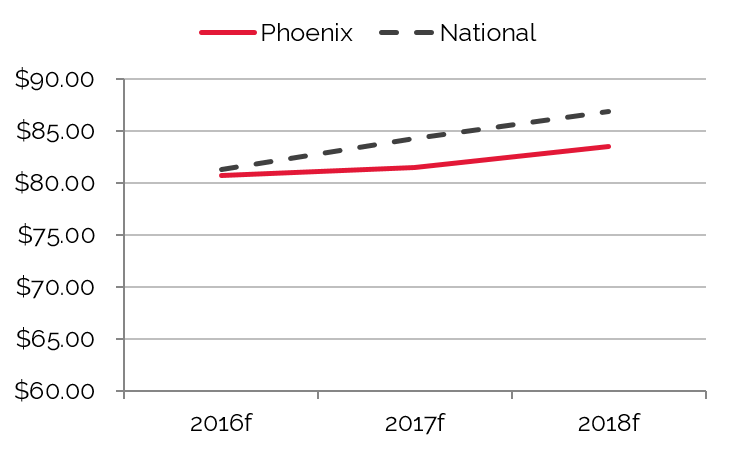
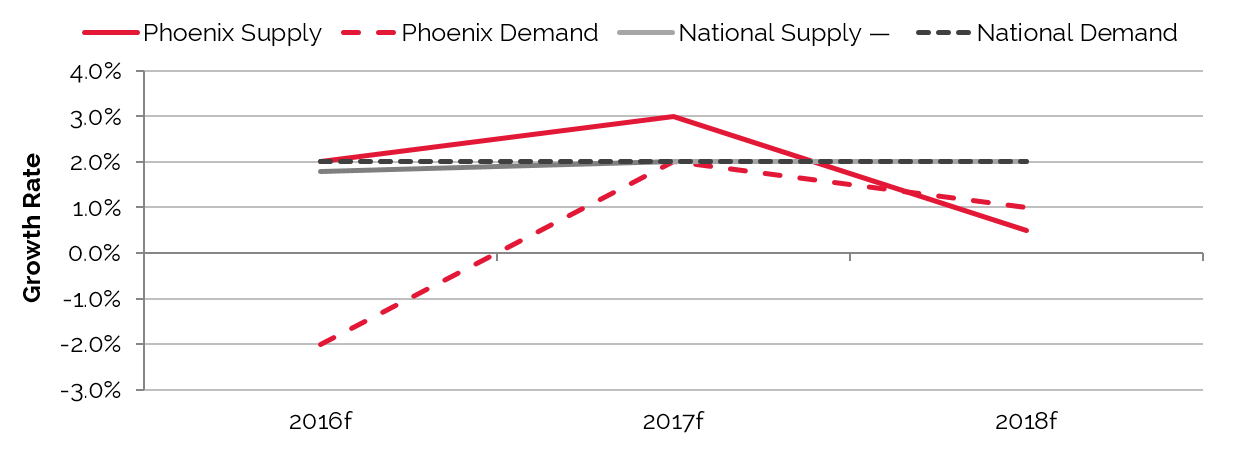
The following charts illustrate trends in occupancy, average rate, and RevPAR for Phoenix hotels’ forecast period from 2016 to 2018.
Occupancy Rises Expected to Peak in 2015
Average Rate Forecast to Rise through 2018
RevPAR to Stabilize 2015-2018
Source: HVS
Following a delayed period of recovery, the greater Phoenix lodging market realized strong year-over-year growth in 2014. A recovering local economy, the lack of new supply, and increased demand during the peak travel season helped to fuel occupancy gains. The boost in demand allowed hotel operators to accelerate gains in average rates; however, average rate for 2014 still remained below its pre-recession level.
In 2015, Phoenix stood as one of the top hotel markets in the U.S. in terms of an accelerated pace of recovery. All of the area’s submarkets realized occupancy, average rate, and RevPAR growth through 2015. Limited supply growth and increased demand across all segments has helped sustain the market-wide recovery. Demand related to Super Bowl XLIX in early 2015 allowed the local hotel industry to post record numbers in the three performance categories. In light of recent trends, strategies to regain rate parity and reposition hotels to pre-recession price points are now in place.
In 2012, negative press and a boycott pertaining to Arizona’s controversial SB 1070 immigration law resulted in minimal demand gains for the Phoenix market, delaying its recovery. Stronger growth was realized in 2013, and this positive trend continued through 2014. RevPAR growth continued in 2015, primarily led by significant average rate gains; it should be noted, however, that both occupancy and average rate were inflated in January 2015, the result of demand from Super Bowl XLIX. Going forward, a modest Super Bowl-related correction to demand is expected in 2016, with moderate growth resuming thereafter as anticipated supply additions stabilize in the market.
Phoenix Supply Forecast to Rise Steadily in the Near Term
Source: HVS
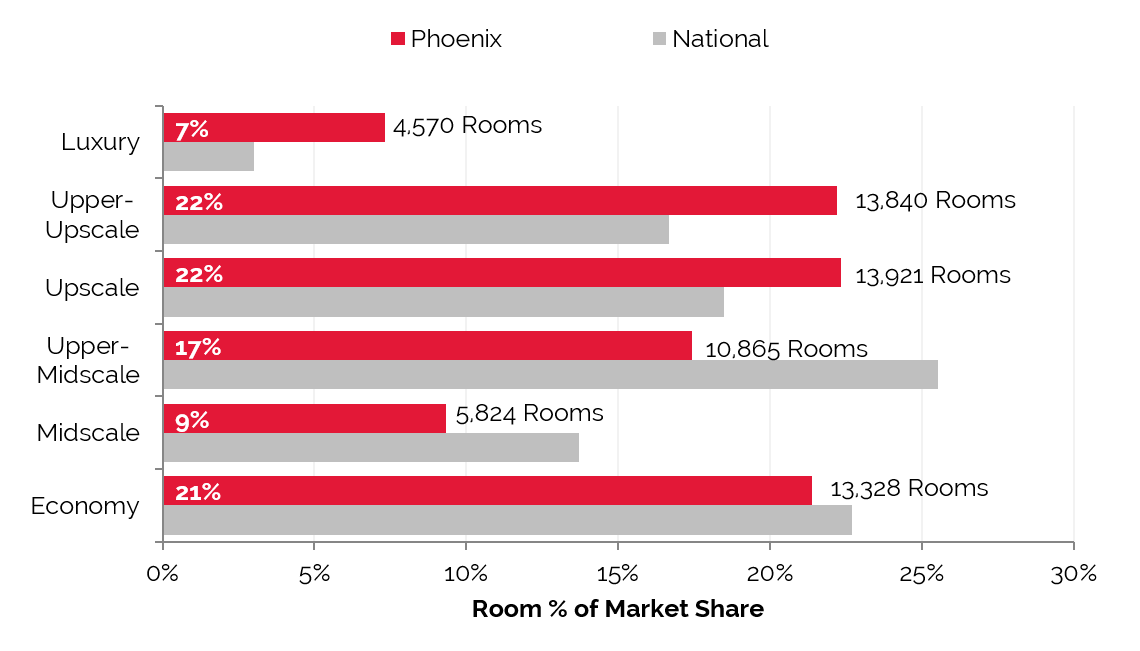
Existing Supply Breakdown by Brand and Scale
The greater Phoenix market consists of 455 hotels and 62,348 hotel rooms. Hotel supply in Phoenix-proper consists of 154 hotels and 25,571 rooms, including full-service, select-service, extended-stay, and limited-service product types representing branded and independent options. The adjacent chart illustrates the mix of current hotels in Downtown/Midtown Phoenix by number of rooms.
Majority of Hotels in Phoenix are Upper-Upscale and Upscale
Source: HVS and STR
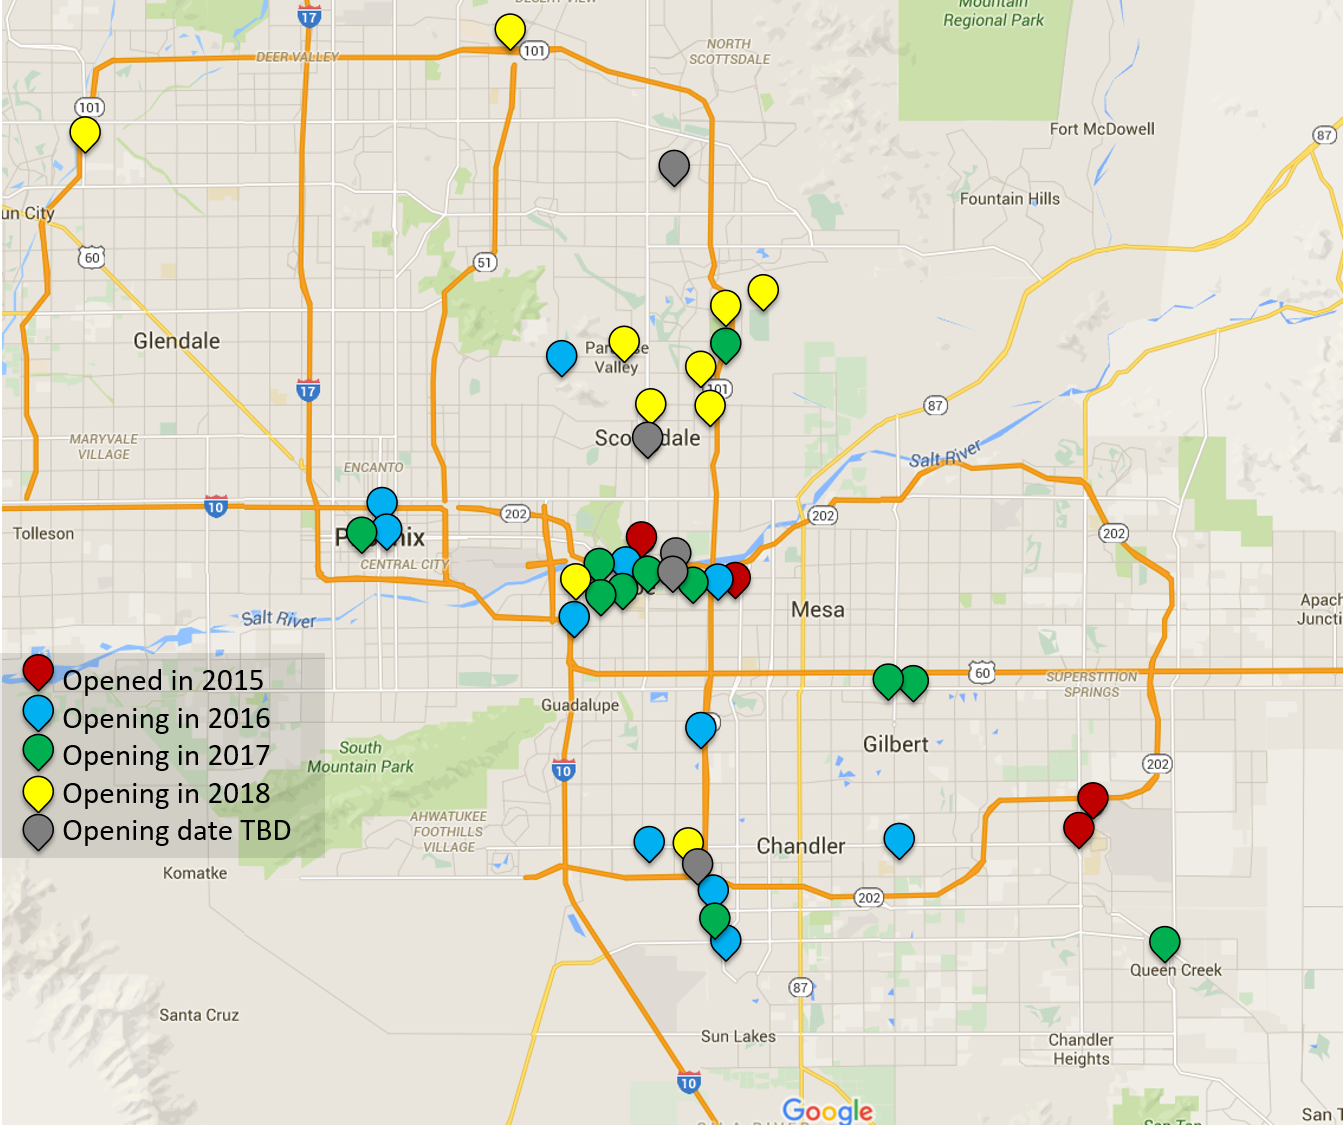
New Supply Pipeline
Lodging development in the Phoenix MSA has been largely muted in recent years, as an abundance of existing supply and reduced demand has kept RevPAR below pre-recession levels. However, stronger revenue growth at area hotels in 2014 has sparked a new wave of development. Despite the uptick in new construction, supply increases are not expected to hinder market-wide revenue growth in the near term, as increases in demand should continue to outpace new construction.
According to HVS research, 14 new hotels are recently opened, currently under construction or close to breaking ground in the market, with another 24 projects in the planning stages.
Tempe and Scottsdale are Anticipated to Receive the Largest
Amount of New Supply in the MSA
Amount of New Supply in the MSA
Source: HVS
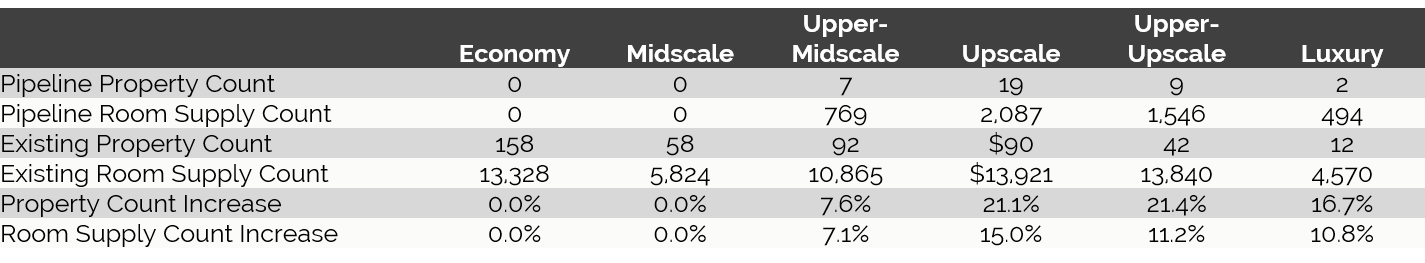
Of the property classes and room counts that have been determined, the following chart illustrates the class breakdown of the new supply.
Majority of New Hotels in the Market will be Upscale*†
Source: HVS,STR, and BuildCentral, Inc.
* Only includes properties with room counts and class designations
† Only the lowest value in the rooms range is considered
Phoenix Supply Forecast to Steadily Rise through 2018
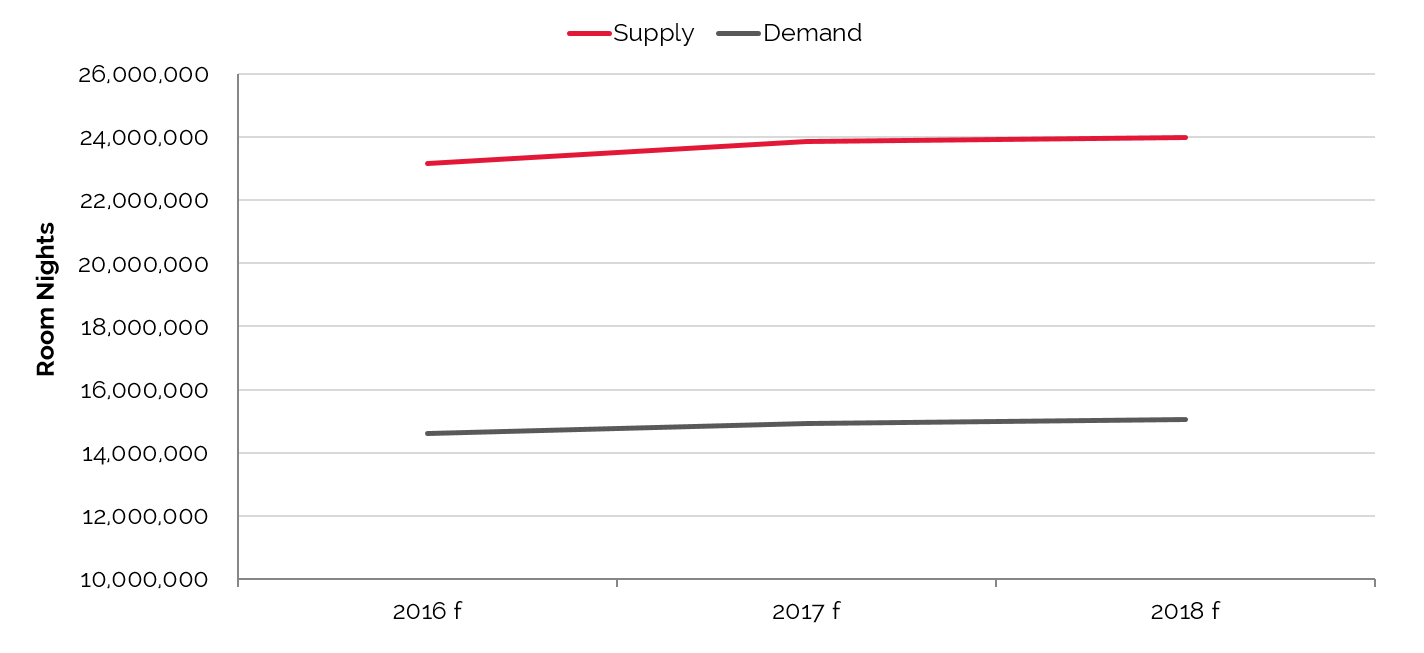
Source: HVS
Downtown Phoenix Lodging Pipeline
As lodging performance in Downtown Phoenix continues to rebound, new hotel development continues to focus on mixed-use, adaptive-reuse projects that include a select- or limited-service hotel component. Despite several available sites, developers have exerted caution in proposing new full-service projects, particularly for ground-up construction, citing suppressed average rates as a major factor. The following Downtown Phoenix sites have been discussed for several years for potential lodging development.
Collier Center: Located at the northwest corner of Third and Jefferson Streets, this site has been entitled for development of a 700-room hotel over a subterranean parking garage. Property ownership is requesting proposals for hotel development on the site.
Arizona Center: A hotel site is reported to be under consideration as part of the mixed-use Arizona Center, which is situated on Van Buren Street opposite Third Avenue from the Sheraton Convention Hotel. This project is considered speculative at this time.
Tempe South Bank: A prime site, located along Tempe Town Lake, is once again under consideration for a full-service hotel with a conference center component. Prior to the last recession, development plans for this site were underway and had gained City approval; however, those plans were curtailed for economy-related reasons.
Currently Proposed under Construction Hotel Projects
Luhrs Block Redevelopment: The proposed dual-branded Courtyard and Residence Inn by Marriott, currently under development at Luhrs City Center, will feature both select-service and extended-stay products. The development is anticipated to include a combined room count of 320 guestrooms and is tentatively set to open in 2016.
The Professional Building: The Hilton Garden Inn will be an adaptive re-use project of the historic Professional Building, which is located in Downtown Phoenix's Central Business District, in the southwest quadrant of the intersection formed by North Central Avenue and West Monroe Street. The proposed Hilton Garden Inn is anticipated to feature 150 rooms and is slated to open in 2016.
Hotel Value Trends
Hotel values and performance in the greater Phoenix lodging market are expected to maintain the strong upward trajectory that launched in 2014 and continued in 2015. One-time events such as the Super Bowl have provided a substantial, immediate boost to the local lodging market, while longer-term improvements in meeting and group demand should support more steady future growth. As such, the Phoenix lodging market is anticipated to enjoy healthy revenue increases as higher demand levels allow operators to push average rate.
Phoenix Hotel Values Suffer Severe Decline in 2009, but Rise Every Year since;
Values Projected to Rise through 2019
Values Projected to Rise through 2019
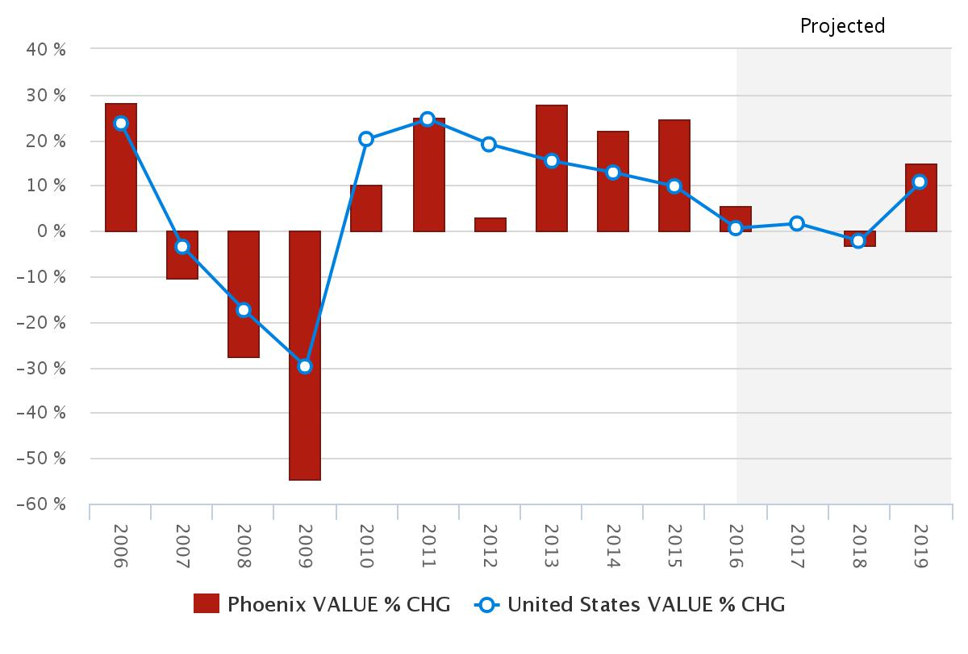
Source: HVS and STR
Value Growth for Phoenix Hotels Predicted to Far Outpace the National Average
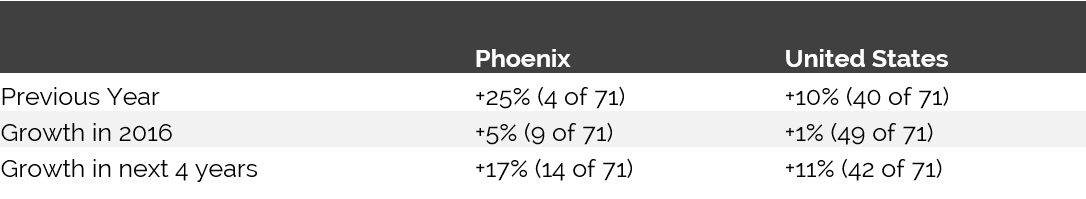
Source: HVS & STR
Recent Hotel Transactions
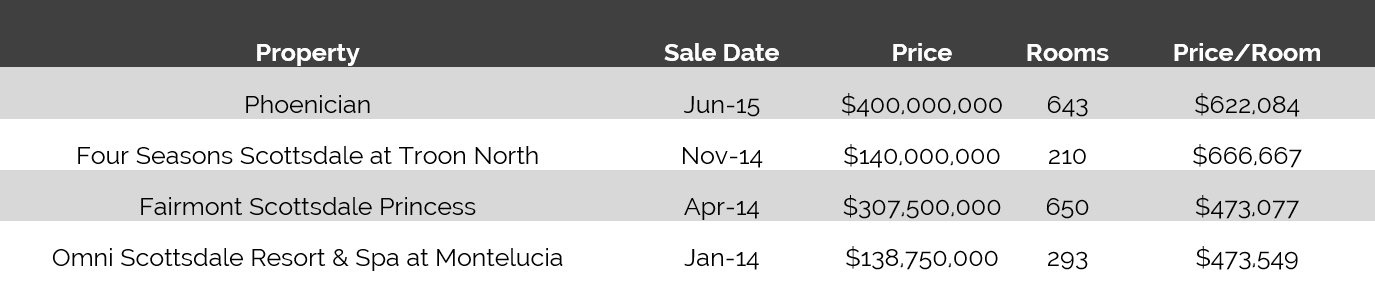
In recent years, hotel transactions in the Phoenix market have accounted for nearly $1.5 billion in total sales. Transaction volume increased an estimated 7.2% across the nation in 2015. Given its state of recovery and expectations of stronger performance in the coming years, Phoenix remains an attractive market for acquiring and repositioning existing assets. This is evidenced by a number of recent acquisitions, including the Phoenician Resort, which will undergo an extensive renovation from 2016 through 2017 to continue its Starwood Luxury Collection affiliation. Hotel transactions in the Phoenix MSA over the last two years are summarized in the following table.
52 Hotel Sales since August 2013, with Average Price per Key of $119,339
Number of Sales Average Price per Room
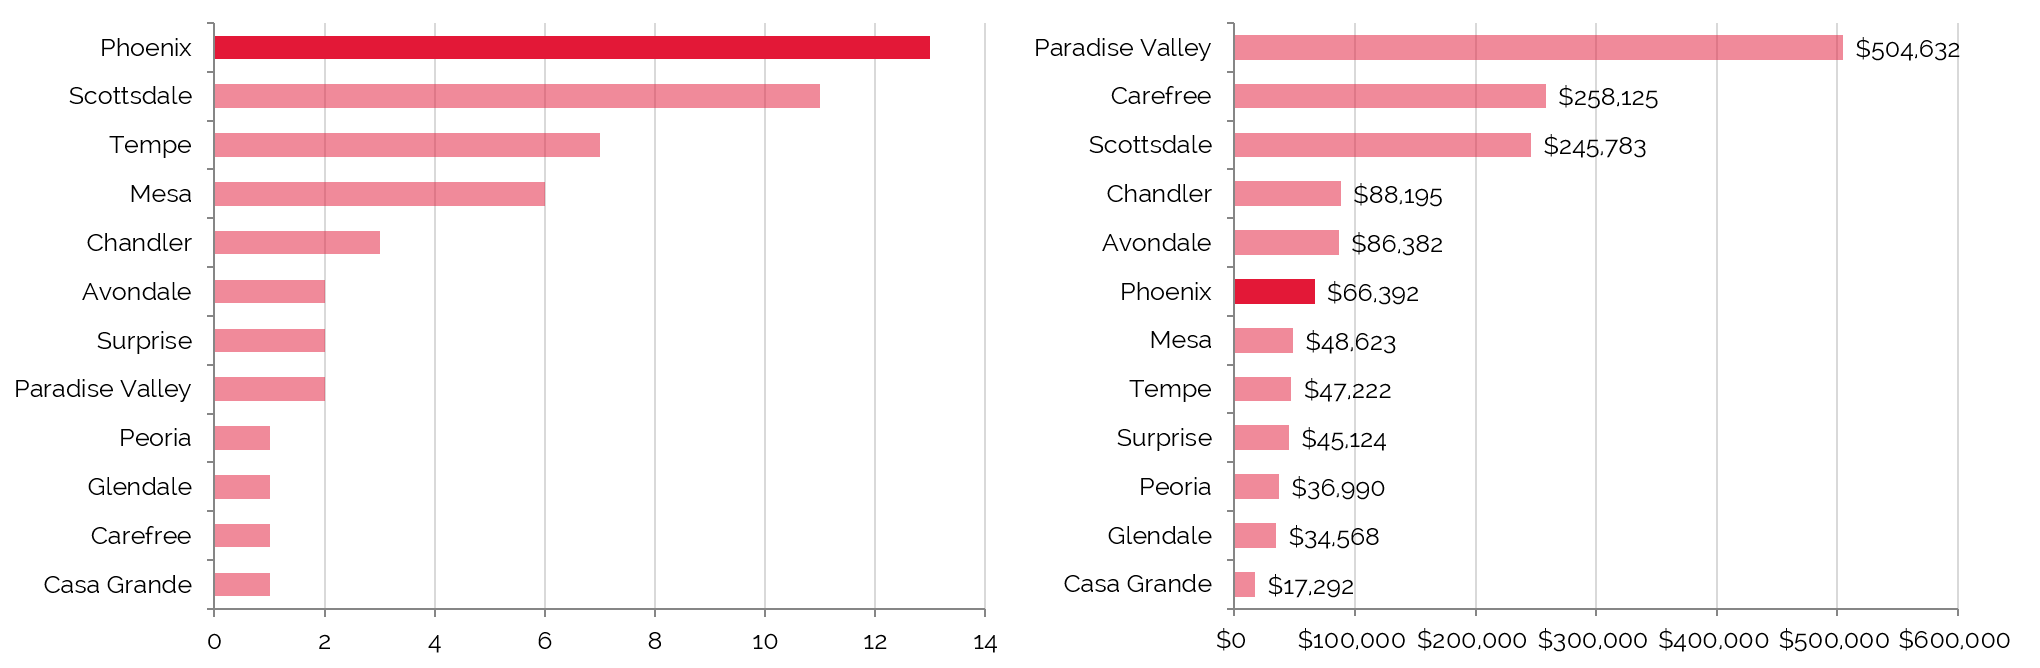
Source: HVS & RCA
Sales across the Phoenix MSA since August 2013 have ranged from $666,667 per key down to $17,292. Thirty-seven, or 70%, of the 52 sales had a per-key price of less than $99,000. Six had a per-key price between $100,000 and $199,000. The mean average price per key was $119,339 and the median was $57,469. The four outlying hotel sales reported in 2014 and 2015 are as follows:
Source: HVS and RCA
Pricing was highly dependent on historical operations, location, product type, and if the property was under financial distress.
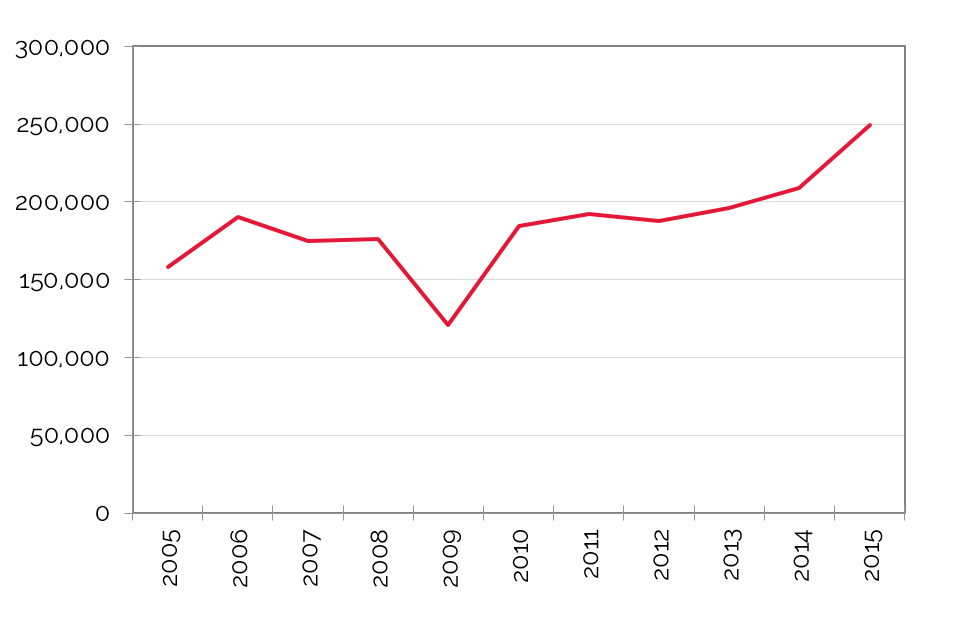
Number of Major U.S. Sales ($10M and above)
![]()
Average U.S. Key Price per Room
Source: HVS and RCA
Key Economic Indicators
Economic and Demographic Review
A primary source of economic and demographic statistics used in this analysis is the Complete Economic and Demographic Data Source published by Woods and Poole Economics, Inc., a well-regarded forecasting service based in Washington, D.C. Using a database containing more than 900 variables for each county in the nation, Woods & Poole employs a sophisticated regional model to forecast economic and demographic trends. Historical statistics are based on census data and information published by the Bureau of Economic Analysis. Projections are formulated by Woods & Poole, and all dollar amounts have been adjusted for inflation, thus reflecting real change.
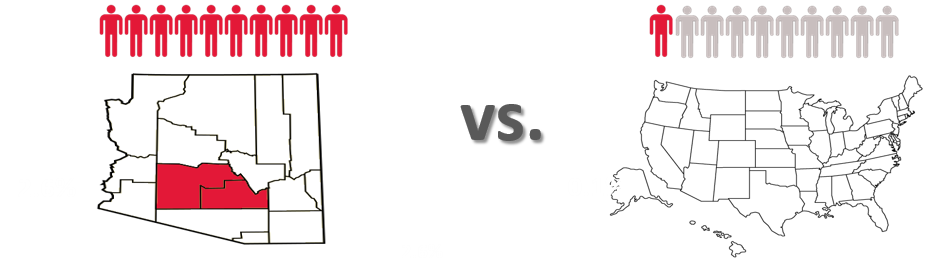
In the 1990s and early 2000s, Phoenix recorded some of the strongest population growth in the U.S., though this growth began to stall in 2008. More recently, the Phoenix MSA’s average annual compounded growth rate of 1.8% is weaker than the past decade’s average of 2.5%, but it is still approximately double the U.S. trend. This serves as a further indication that Phoenix is trending back toward its pre-recession standing.
Demographics by Radius from the Center of the CBD in Downtown Phoenix
Population Growth in Phoenix Soars 90% Ahead of National Average
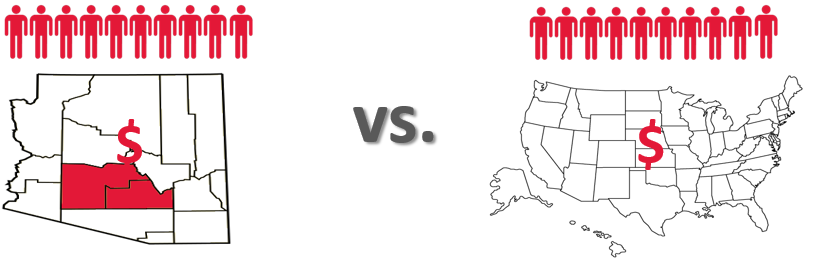
Per-Capita Personal Income for the Phoenix MSA Matches that of Nation from 2010 to 2015
Source: "Phoenix MPA Incorporated and Planning areas" by Ixnayonthetimmay
Based on public domain information. Licensed under Public Domain via Commons - https://commons.wikimedia.org/wiki/File:Phoenix_MPA_Incorporated_and_Planning_areas.svg#/media/File:Phoenix_MPA_
Incorporated_and_Planning_areas.svg
Based on public domain information. Licensed under Public Domain via Commons - https://commons.wikimedia.org/wiki/File:Phoenix_MPA_Incorporated_and_Planning_areas.svg#/media/File:Phoenix_MPA_
Incorporated_and_Planning_areas.svg
Radial Demographic Indicators
This source reports a population of 358,214 within a five-mile radius of Downtown Phoenix, and 122,951 households within this same radius. Average household income within a five-mile radius of Downtown Phoenix is currently reported at $47,503, while the median is $32,883. The following table reflects radial demographic trends for the market area measured by three points of distance from the center of Downtown Phoenix.
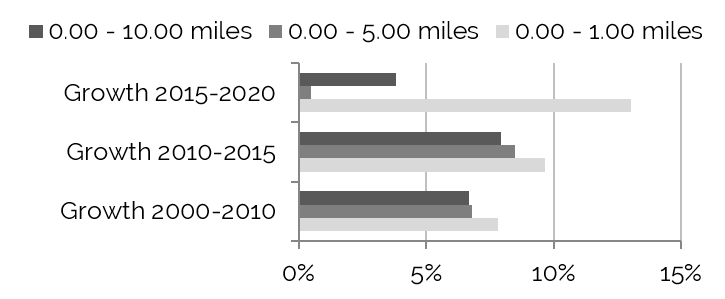
Population Growth Expected to Taper
from 2015 to 2020

Overall Household Growth to Slow
from 2015 to 2020
Source: The Nielson Company
Top Occupations within
One-Mile Radius

Top Occupations within
Five-Mile Radius

Top Occupations within
Ten-Mile Radius

Source: The Nielson Company
2016 Forecast - Average and Median Household Income within 10-Mile
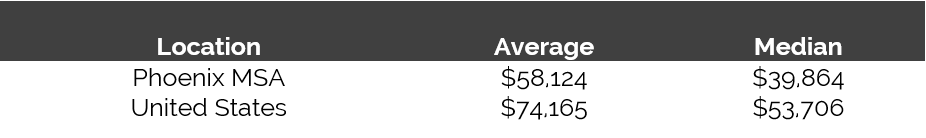
Source: The Nielson Company
Workforce Characteristics
The characteristics of an area’s workforce provide an indication of the type and amount of transient visitation likely to be generated by local businesses. Sectors such as finance, insurance, and real estate [FIRE]; wholesale trade; and services produce a considerable number of visitors who are not particularly rate-sensitive. The government sector often generates transient room nights, but per-diem reimbursement allowances often limit the accommodations selection to budget and mid-priced lodging facilities. Contributions from manufacturing, construction, transportation, communications, and public utilities [TCPU] employers can also be important, depending on the company type.
Phoenix is ranked #44 by Forbes’ Best Places for Business and Careers. The healthcare sector in the Phoenix MSA showed the biggest gains in 2015, as evidenced by the expansions of the Phoenix Biomedical Campus, IGC/TGEN, the Arizona Biomedical Collaborative, the University of Arizona Medical School, Arizona State University’s School of Nursing Phase II and Health Science Education Building, Banner Health, and the Mayo Clinic. Area employment continues to benefit from major employers including the State of Arizona, Banner Health, Wells Fargo, Arizona State University, Intel, Bank of America, Scottsdale Lincoln Health Network, and Honeywell.
The following table sets forth the Phoenix MSA workforce distribution by business sector in 2000, 2010, and 2015, as well as a forecast for 2020.
Phoenix MSA Historical & Projected Employment
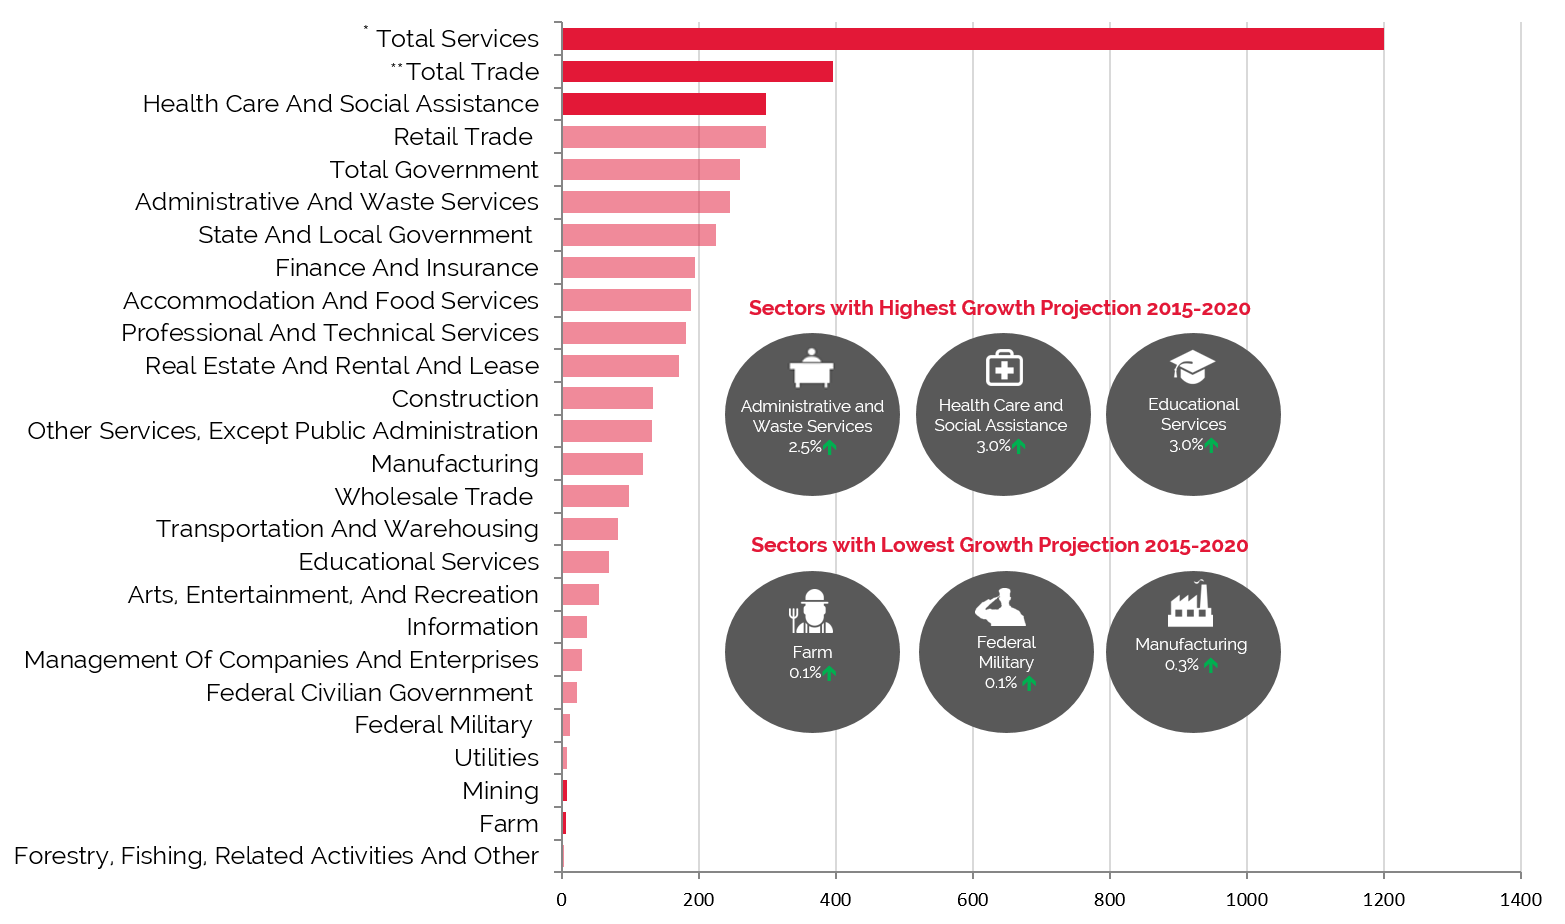
Source: Woods & Poole Economics, Inc.
Finance, insurance, and real estate [FIRE]; wholesale trade; and services are employment sectors that drive upper-midscale through luxury room nights. These sectors combined represented 62.9% of total employment in 2014, with an average annual compounded growth rate for the group expected to be approximately 1.9% in 2020.
The growth rate of the Total Government sector, considered a room-night driver for economy hotels, has fluctuated over the past 15 years, but succeeds at maintaining approximately 10% of total employment in the Phoenix MSA.
Forecasts developed by Woods & Poole Economics, Inc. anticipate that total employment in the Phoenix MSA will change by an accelerated 2.1% on average annually through 2020. The trend is above the forecast rate of change for the U.S. as a whole during the same period. The Total Services sector is forecast to increase as a percentage of the total workforce by 2020, with the greatest sub-sector increase in Health Care and Social Assistance.
Employment
Greater Phoenix serves as a hub for aerospace, high-tech, bioscience, advanced business services, and sustainable technologies companies. Additionally, tourism is an especially vital component of the economy, with more than 16 million visitors arriving annually from throughout the United States and Canada. Phoenix is also an important resort and regional meeting destination. Strong visitation levels during the market’s peak season continue to bolster employment.
The following table illustrates historical and projected employment, population, and income data for the overall Phoenix market, as presented by REIS.
Historical & Projected Employment, Households, Population,
and Household Income Statistics for the Phoenix MSA
and Household Income Statistics for the Phoenix MSA
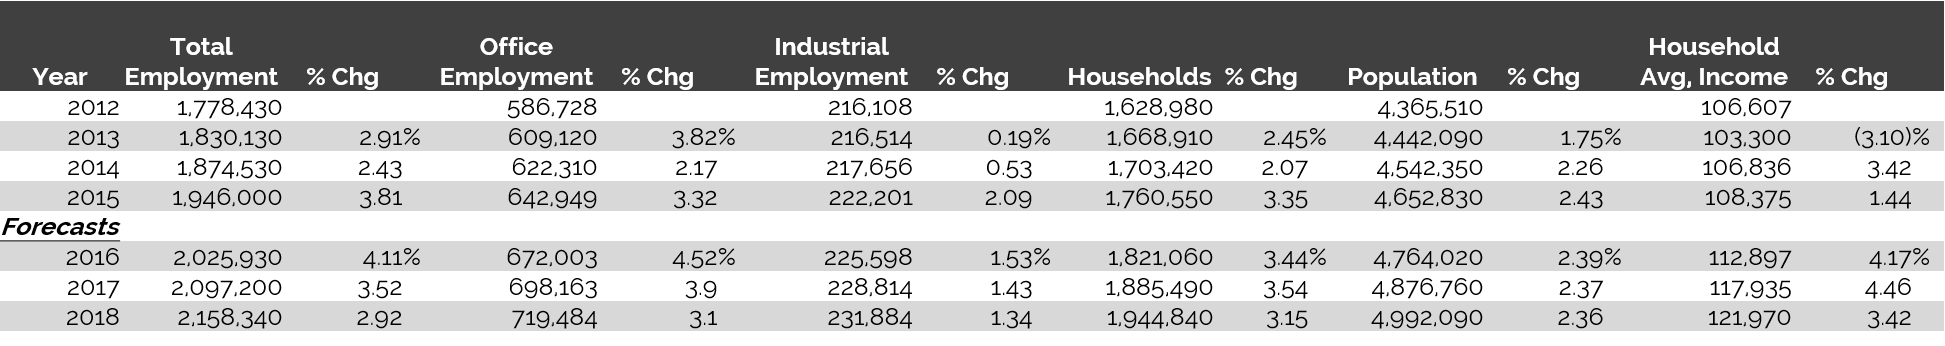
Source: REIS Report, 1st Quarter, 2016
Top Industries In The Phoenix MSA
Financial services companies employ a significant percentage of the workforce in Downtown Phoenix workforce, where Quarles and Brady, Alliance Bank, Wells Fargo, Bank of America, Chase, U.S. Bank, and Ernst & Young all maintain offices. Other major employers include companies such as Banner Health, Ballard Spahr, and Freeport McMoRan. In addition, the downtown area is in the midst of a transformation into a thriving hub for higher education and medical research. The Arizona State University (ASU) Downtown Phoenix campus, which began construction in the middle of the last decade, includes the Walter Cronkite School of Journalism & Mass Communication and KAET Channel Eight (Arizona’s PBS affiliate), among other ASU programs.
At full build-out, the 30-acre Phoenix Biomedical Campus is expected to feature more than six million square feet of biomedical facilities. Anchored by the UA College of Medicine, the campus is currently home to the Arizona State School of Nutrition and Health Promotion, the Translational Genomics Research Institute, the National Institute of Diabetes and Digestive and Kidney Diseases, the International Genomics Consortium, and the Northern Arizona University College of Health and Human Services. Downtown Phoenix continues to attract a diverse mix of employers as users seek to take advantage of the centrally located neighborhood’s light-rail, vehicular, and pedestrian access.
Major Employers in Phoenix Range from Government to Financial Services to Higher Education
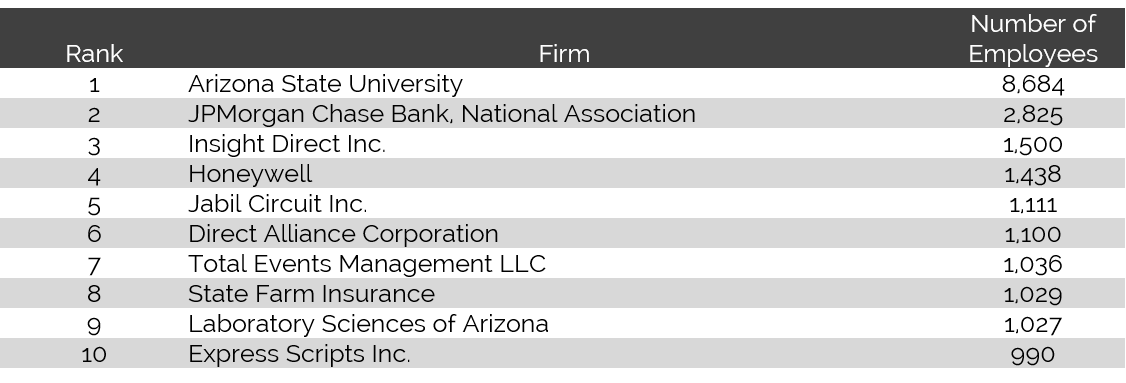
Source: Phoenix Business Book of Journal List, 2014
Area Development Projects
Banner Health In 2015, it was announced that Banner Health would relocate its headquarters from the Banner Good Samaritan Medical Center to a larger office space in Midtown Phoenix.
Phoenix Biomedical Campus The recently completed 220,000-square-foot University of Arizona Cancer Center opened at the Phoenix Biomedical Campus on August 24, 2015. The $100-million facility will focus on comprehensive, outpatient cancer care. An additional 155,000-square-foot Phoenix Biomedical Research Center is also planned for the campus.
ASU Downtown Campus In July 2014, construction of the new $129-million Arizona Center for Law and Society began at the ASU Downtown Phoenix campus; this development, which includes the relocation of the Sandra Day O’Connor College of Law, will reportedly be completed by 2016. The Sandra Day O’Connor College of Law will occupy the city block defined by Taylor Street to the north, Second Street to the east, Polk Street to the south, and First Street to the west.
Light Rail The City of Phoenix completed the construction of its METRO light rail in 2008, which extends approximately 20 miles through Phoenix, Tempe, and Mesa; furthermore, the light rail provides service to Sky Harbor International Airport and brings more convenience to both residents and visitors. A 3.2-mile northwest extension is currently underway, with completion planned for early 2016. Additional extensions are in various phases of planning.
State Farm In July 2013, construction began on the two-million-square-foot State Farm Insurance regional headquarters building in Tempe. The $600-million facility will also feature 40,000 square feet of retail space and 8,500 parking stalls. The development is expected to open in phases between mid-year 2015 and 2017.
Apple Following the bankruptcy of GT Advanced Technologies, Inc., a sapphire-glass supplier, Apple announced plans to establish a command center for its global data networks at the Mesa plant in early 2015. Apple has committed to invest $2 billion over the next ten years at the facility, which is expected to generate 150 full-time jobs.
Mayo Clinic The Mayo Clinic has dedicated an additional $130 million to consolidate its cancer program at the clinic’s $182-million Proton Beam Therapy facility, which began construction in December 2011 in northern Phoenix. The clinic began accepting patients in 2015, with the Proton Beam Therapy facility anticipated to start treatments in March 2016.
ASU Tempe Campus In late 2014, Catellus Development Corporation was selected by ASU to master develop 330-acre of campus athletic facilities. The athletics facilities district, which is expected to take 20 years to build out, will include a mixture of retail, office, and research developments.
Unemployment
After showing year-over-year improvement, unemployment began to rise in 2008 and increased sharply in 2009, with job losses related to cutbacks and downsizing in several sectors during the national recession. The area's unemployment rate peaked in 2010, but then began to decline in 2011; this positive trend continued through 2014. The most recent comparative period reflects improvement, as illustrated by the latest data for 2015 and supported by reported employment increases in the financial and healthcare sectors. Longer-term improvements should be supported by increased hiring efforts in the construction industry given the ongoing recovery of the residential housing market in Phoenix.
While Falling, Unemployment in Phoenix Remains above National Average
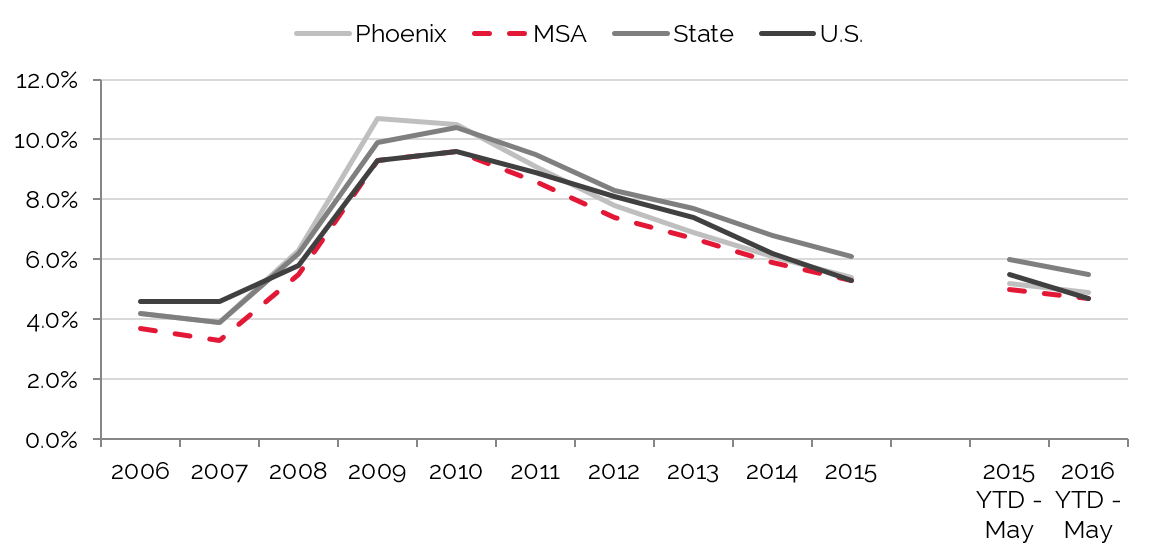
Source: U.S. Bureau of Labor Statistics
Office Space
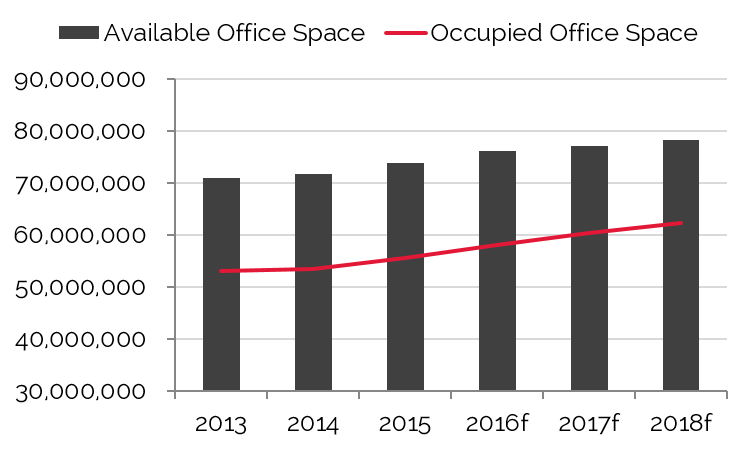
Trends in occupied office space are typically among the most reliable indicators of lodging demand, as firms that occupy office space often exhibit a strong propensity to attract commercial visitors. Thus, trends that cause changes in vacancy rates or in the amount of occupied office space may have a proportional impact on commercial lodging demand and a less direct effect on meeting demand. The following table details office space statistics for the pertinent market area.
Majority of Office Space Square Footage Located in Scottsdale
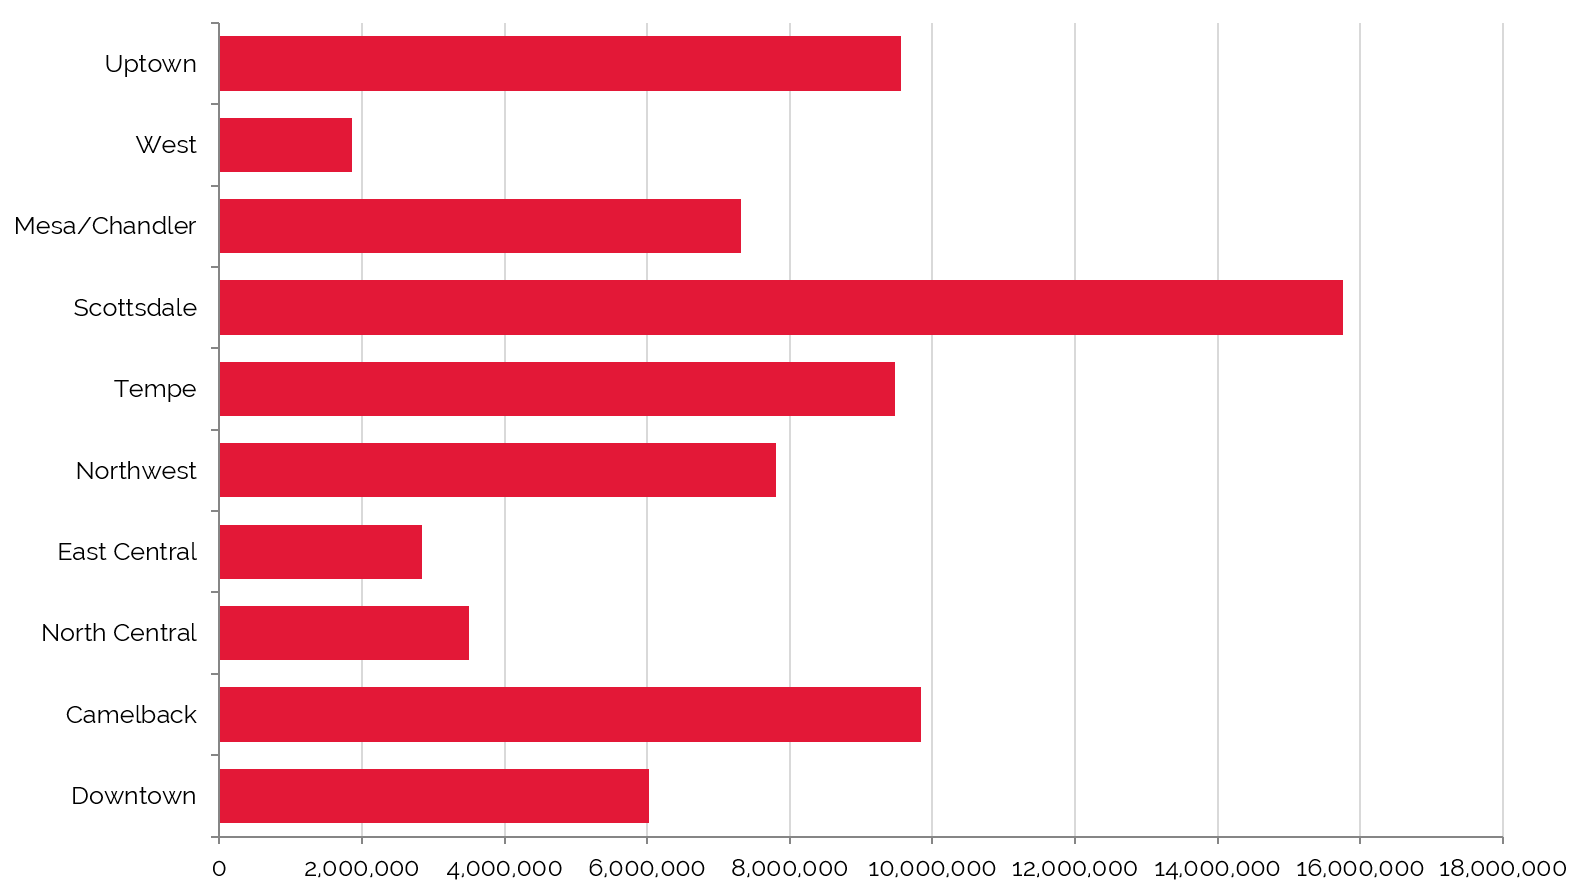
Source: REIS Report, 1st, Quarter 2016
Vacancy Highest in the West Submarket; Downtown Submarket
Commands Highest Average Asking Lease Rate
Commands Highest Average Asking Lease Rate
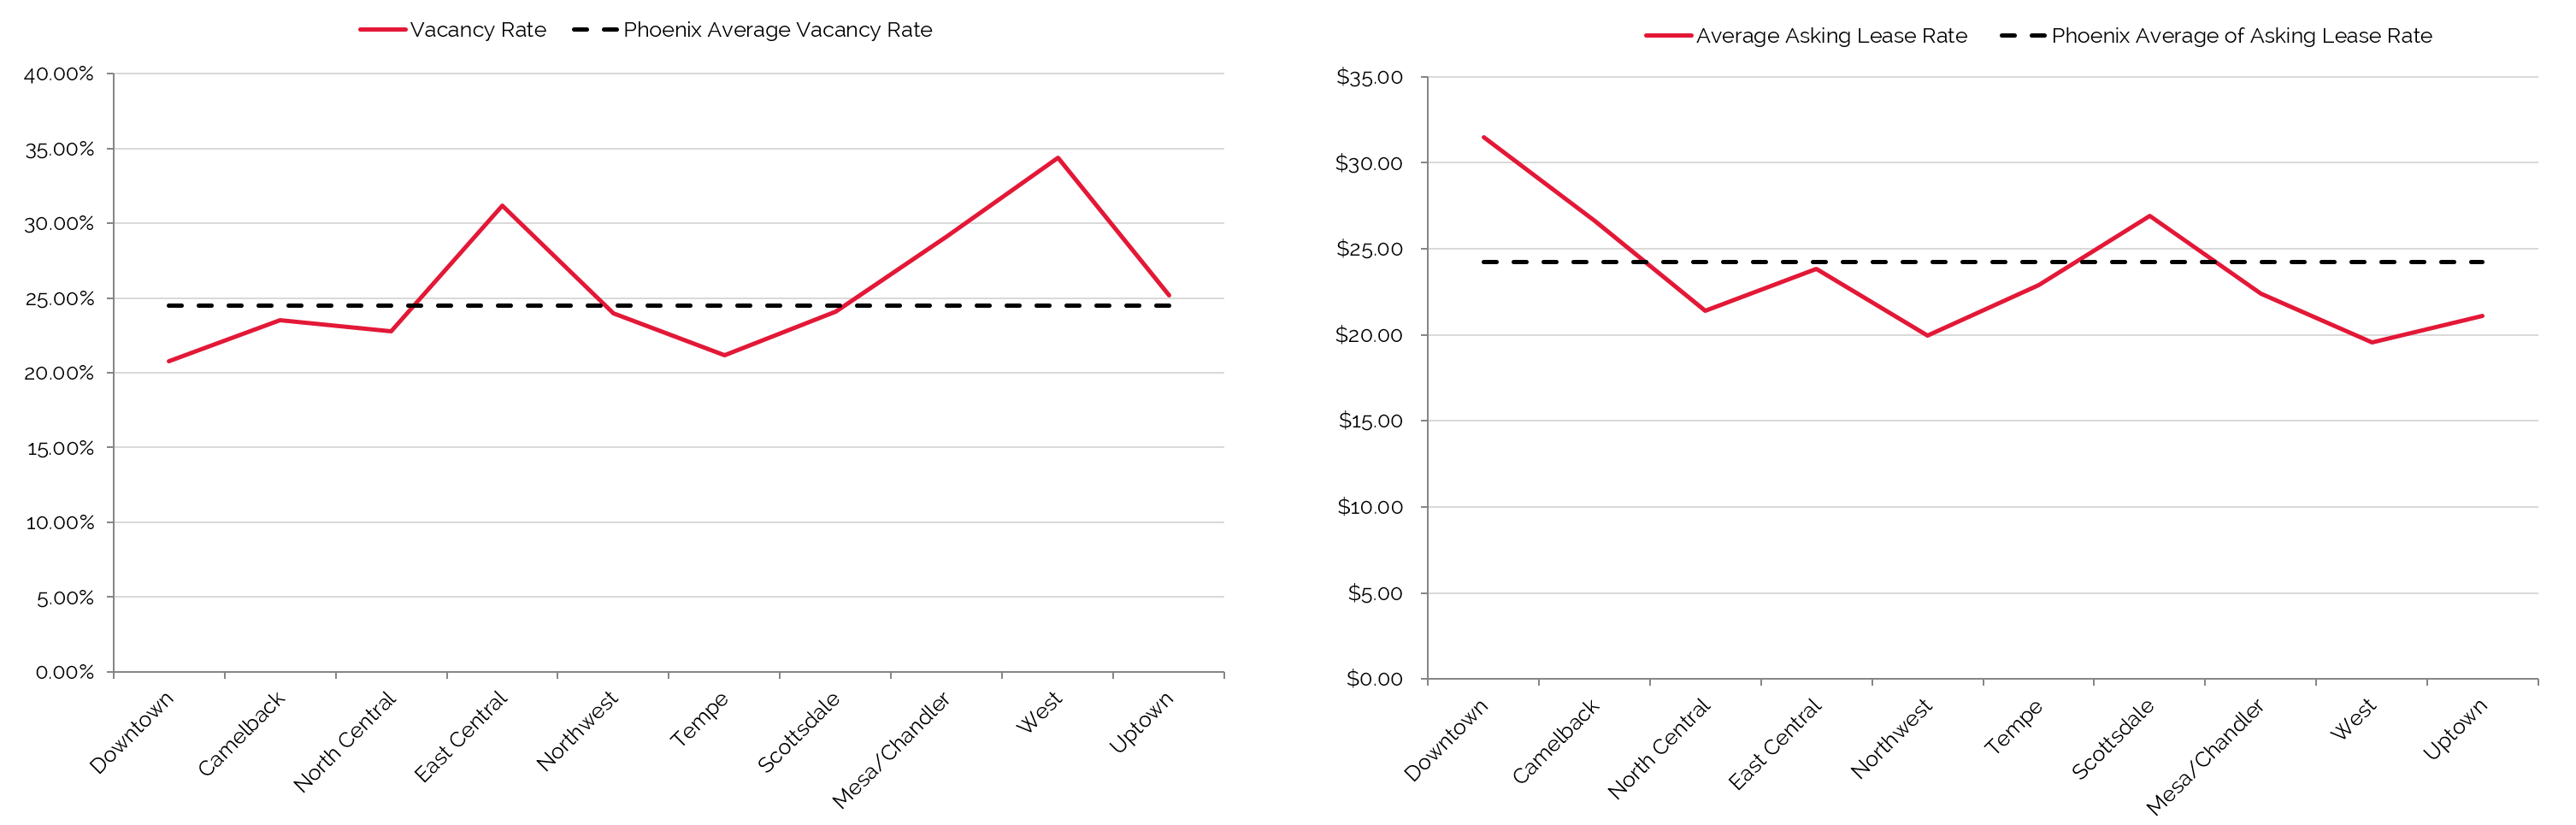
Source: REIS Report, 1st Quarter, 2016
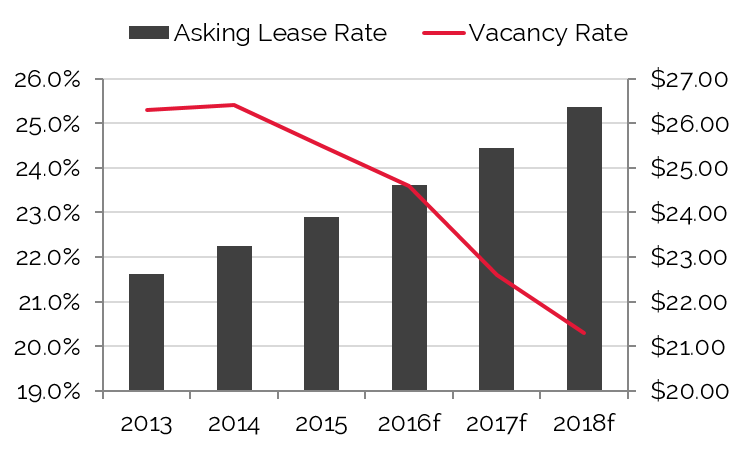
Given the Phoenix MSA's sprawling development pattern, the Downtown office submarket accounts for just over 6.0 million square feet within the area’s total inventory of about 74 million square feet. As of the first quarter of 2016, the Downtown office submarket had the lowest vacancy rate in the Phoenix metropolitan area. During the same quarter, this submarket outperformed all others in terms of average asking lease rate, by a notable margin. No new office supply is anticipated in the immediate future for Downtown Phoenix, with the 568,000-square-foot CityScape development in 2010 being the last significant addition. However, refurbishments of existing buildings are underway to keep office space in Downtown Phoenix competitive within the region. As Downtown Phoenix continues to redevelop, this submarket is expected to remain a premier relocation destination for businesses and corporations. Factors such as the Luhrs City Center and Phoenix Biomedical Campus developments, the ASU campus, and light-rail lines are helping to secure this position.
Available Office Space and Occupied Office Space in Phoenix
Asking Lease Rates Forecast to Rise
Source: REIS Report, 1st, Quarter 2016
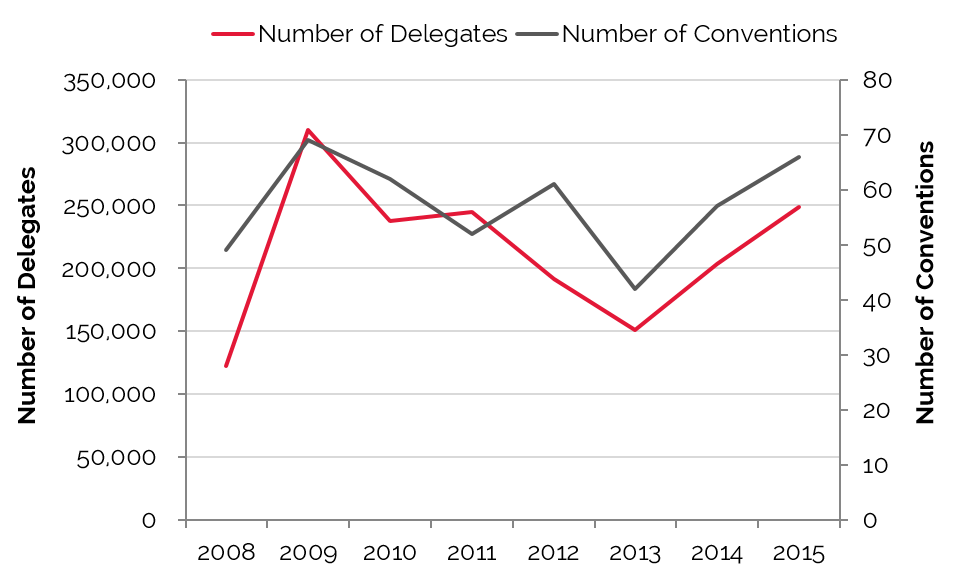
Convention Activity
Convention centers generate significant levels of demand for area hotels, particularly those within a radius of three miles. Convention headquarters hotels command premium rates and, in addition to capturing event-related demand, can also benefit from hosting related banquet events. Major conventions also push demand to peripheral hotels and resorts in the market.
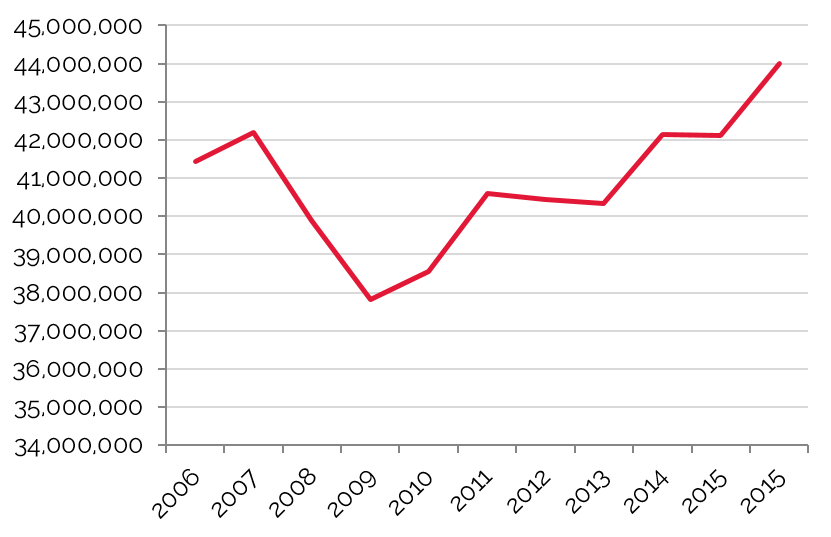
Delegate Counts Peak in 2009, Rebound in 2014
Source: Phoenix Convention Center
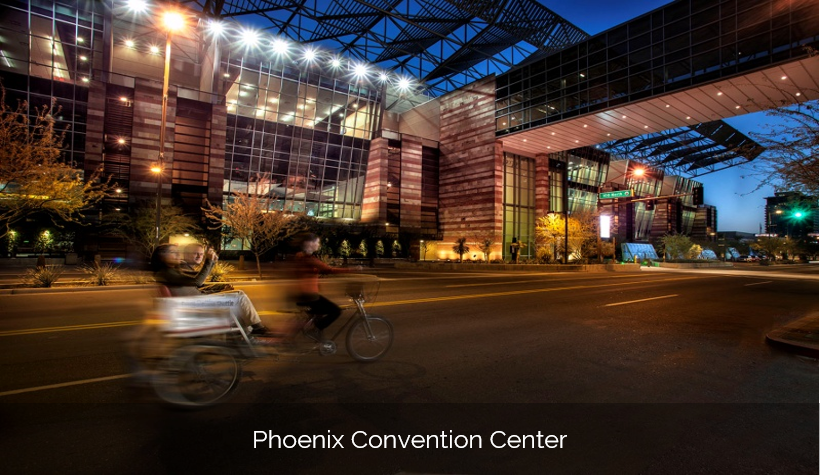 The Phoenix Convention Center is one of the 20 largest convention centers in the nation. A $600-million expansion of the facility was completed in 2009; the three-phase expansion increased the total rentable space at the Civic Plaza to 900,000 square feet, situated on a 24-acre site. In addition to the convention center, events can be held at Symphony Hall, located to the south of the Executive Conference Center. The Valley Metro light-rail system’s westbound line runs between the north and south buildings, and an eastbound line runs along the southern boundary of the site; the Metro connects the Phoenix Convention Center to the Sky Harbor International Airport.
Statistics for 2014 illustrate a strong rebound in both the number of events and delegates, as the negative impacts of SB 1070 began to subside. Local convention officials noted that the positive exposure from hosting major events related to Super Bowl XLIX in early 2015 showcased Downtown Phoenix on a national level. The booking pace in 2015 was ahead of that of 2014, due in large part to the newly acquired Grace Hopper Celebration (GHC) of Women in Computing convention, which had to cap its attendance at 8,500. This positive momentum should carry forward, and GHC has begun negotiations to return in 2016.
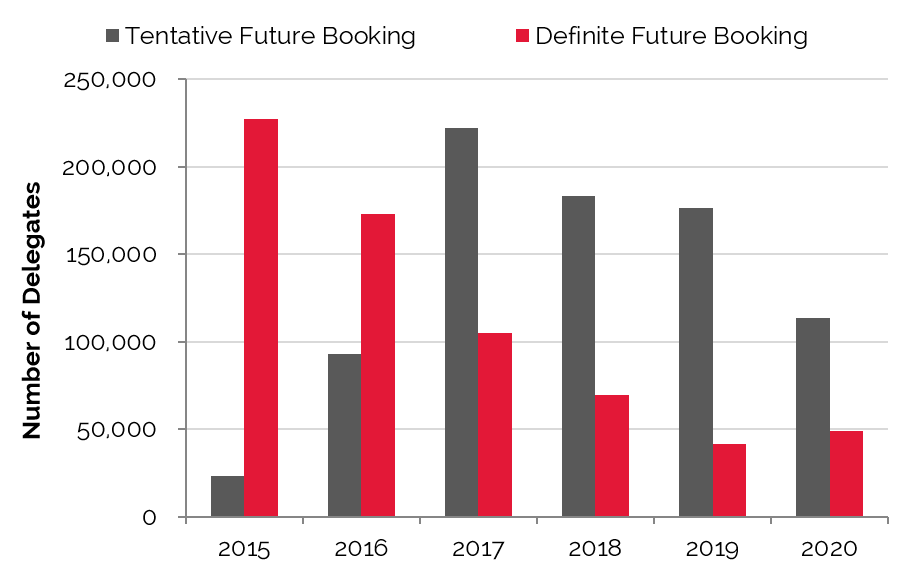
Convention Delegates:
Future vs. Tentative On-the-Books
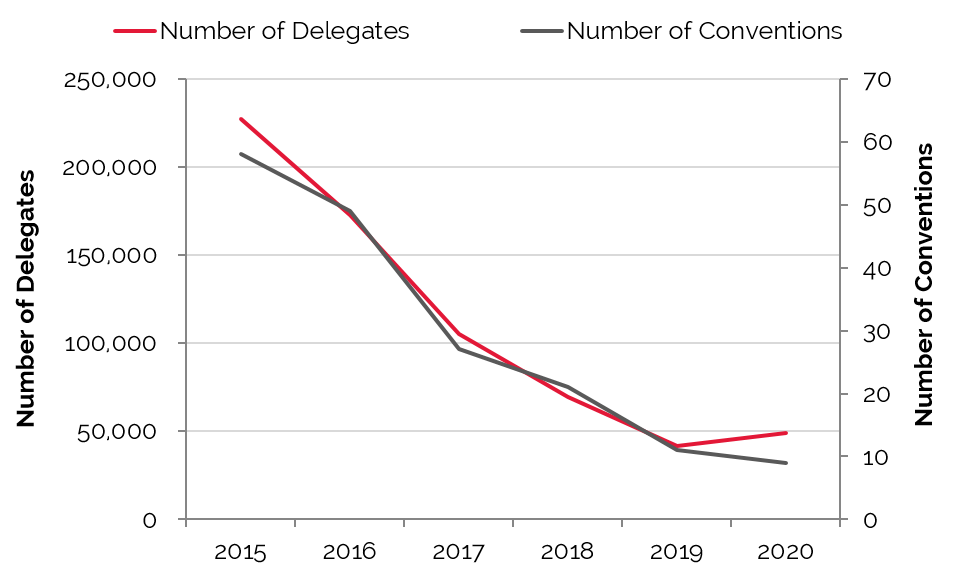
Convention and Delegates:
On-the-Books
Source: Phoenix Convention Center Source: Phoenix Convention Center
Based on information provided by the Convention & Visitor's Bureau, the Phoenix Convention Center is expected to realize year-over-year gains in the near term, as meeting planners are once again considering Phoenix as a prime destination for large conventions and conferences. The Phoenix Convention Center, like many of its peers, is coping with the new trend of shorter booking windows for prospective groups. Back in 2011, a three- to five-year booking window was common for larger conferences and conventions. However, it is currently common for many of these groups to book within the year, placing more importance on a facility's tentative booking pace compared to its definite booking pace.
Historically, the Phoenix Convention Center has primarily accommodated groups of 1,500 to 2,000 attendees. Local convention officials noted that this trend is changing, as more groups in the 5,000–7,000 range are showing interest in the Phoenix market. This positive change supports the convention center's expectations of surpassing its 2009 room-night peak by 2016. It is generally thought that the convention center can accommodate roughly 20% more business before it reaches capacity. In order to bridge this gap, local officials are focusing on leveraging growth industries within the downtown area, including the biotechnology and healthcare sectors, to prospect new groups for the facility. While the Phoenix Convention Center still has ground to make up, positive strides in 2014 and 2015 are expected to set the stage for continued growth in the coming years.
Airport Traffic
Airport passenger counts are important indicators of lodging demand. Depending on the type of service provided by a particular airfield, a sizable percentage of arriving passengers may require hotel accommodations. Trends showing changes in passenger counts also reflect local business activity and the overall economic health of the area.
Phoenix Sky Harbor International Airport (PHX) is the principal gateway for the Valley of the Sun region of Arizona, with major commercial airlines serving cities in the U.S., Canada, Mexico, and Europe. Airport growth has been spurred by a surge of population and job gains in the state over the last decade, as well as the successes of Dallas-based Southwest Airlines and US Airways (now American Airlines).
Passenger Traffic Plummets in 2009, Surpasses Previous Peak in 2015
Source: Phoenix Sky Harbor International Airport
Tourist Attractions
Phoenix’s tourism industry is driven largely by the area’s abundance of five-star resorts, world-class spas, first-class restaurants, and championship golf courses. Tourism in the area is strongest from January to April, and specifically during March, when professional baseball teams come to the area for Spring Training. The region's hot, arid summer weather causes tourism to decline from May to August, although it picks up again in September and October.
 Downtown Phoenix benefits from its central location within the metropolitan area, proximate to Phoenix Sky Harbor International Airport, the University of Phoenix Stadium in Glendale, and the numerous leisure and entertainment options in the East Valley. Tourism anchors in the downtown neighborhood include Chase Field, home of the Arizona Diamondbacks, and US Airways Center, home of the Phoenix Suns, as well as several cultural and entertainment options. More recently, Roosevelt Row, part of the Downtown Phoenix Arts District, has been catalyst for the reinvention of Downtown Phoenix. For years, the downtown neighborhood lacked a unique feature to set it apart in the region, but Roosevelt Row’s eclectic mix of arts and cultural events, award-winning restaurants, galleries, boutiques, and live music, is quickly filling that void.
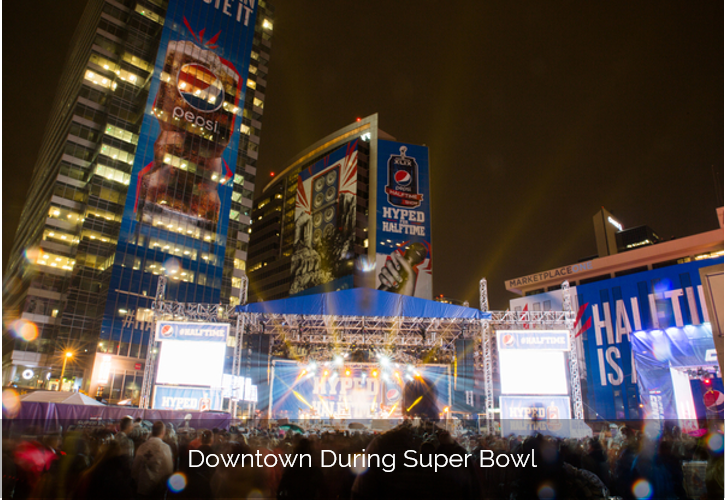
  Furthermore, Phoenix’s proclivity for hosting some of the world’s top sporting events makes the downtown market a destination point in the region. During the most recent Super Bowl and Pro Bowl in 2015, Downtown Phoenix was center stage for Super Bowl-related activities, including the popular NFL experience, despite the Super Bowl game being played at the University of Phoenix Stadium in nearby Glendale. In June 2015, ASU officials announced that the 2015 Super Bowl generated more than $719 million in total economic impact for greater Phoenix, eclipsing the $600-million target set by the Arizona Super Bowl Host Committee. By comparison, the figures for 2015, when adjusted for inflation, were nearly 31% higher than the previous Phoenix Super Bowl in 2008. While the market experienced a substantial bump in tourism related to Super Bowl XLIX, additional major sporting events on the horizon should assist the market in maintaining strong leisure levels. These events include the NCAA Championship Football Game in 2016 and the 2017 NCAA Division I Men’s Final Four Basketball Tournament.
Closing Remarks
Greater Phoenix is experiencing a period of economic recovery that is apparent across multiple industries, from health care to tourism. The area’s economy, supported by a multitude of diverse companies and sectors, has been rejuvenated over the past several years, with tourism and convention activity making major gains in 2014. In addition, ongoing expansions at the ASU Downtown Phoenix campus and Phoenix Biomedical Campus are supporting renewed growth in the city's downtown core. City investments and partnerships in infrastructure and redevelopment projects continue to attract employers and support event venues, spurring further economic growth in the market. In sum, Phoenix has begun to trend similarly to the broader national patterns of economic recovery, albeit at a somewhat slower pace, as evidenced by a variety of economic indicators including the unemployment rate and housing starts. Hotel supply is set to rise after several years of stagnation, though demand is expected to keep pace. New projects and grand-scale events, such as the Super Bowl and Pro Bowl in 2015, as well as the annual Cactus Bowl, the Fiesta Bowl, and the Phoenix Open, have supported further growth, providing for a generally positive outlook for the Phoenix market in the near term.