Together, Minneapolis—Minnesota’s largest city—and St. Paul—the state capital—comprise the second-greatest economic landscape in the Midwest, behind only Chicago. The market’s diversity is immense, with economic and hotel demand generators extending from Fortune 500 companies to international tourism to professional sports franchises. Over the past ten years, and despite the fallout from the 2008/09 recession, hotels in the greater Minneapolis-St. Paul (MSP) market have enjoyed fairly stable occupancy levels in the low-to-mid 60s. This stability has provided a platform for rising average rates, which have increased significantly in recent years, largely because of corporate demand generated by 3M, Target, Medtronic, U.S. Bank, Cargill, and Best Buy. The following report details recent economic and hotel market dynamics in Minneapolis-St. Paul, as well as projections for hotel performance and values.

Hotel Market Performance
Overview of Historical Occupancy and Rate Trends
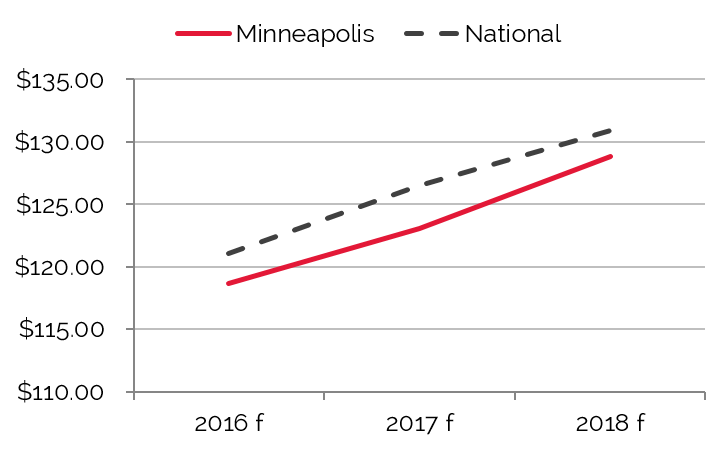
The following charts illustrate trends in forecasted hotel occupancy, average rate, and RevPAR for Minneapolis-St. Paul from 2016 to 2018.
Occupancy Grew through 2015; Average Rate and RevPAR Forecast to Continue to Rise
MSP’s Occupancy Grew through 2015
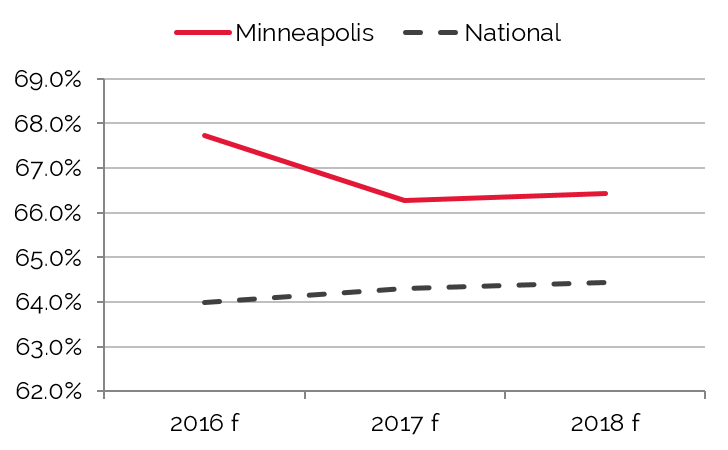
Average Rate Expected to Increase through 2018
MSP’s RevPAR on Par with National Level
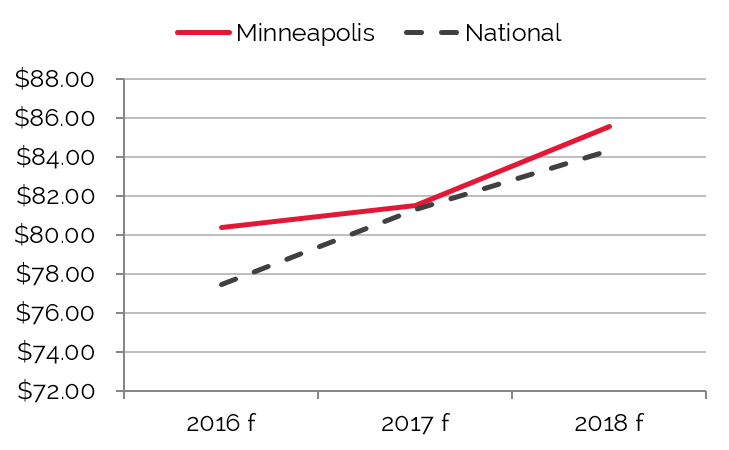
Source: HVS
Year-end data for 2013 show a moderate increase in occupancy, due in part to improved commercial and leisure demand to the area, in addition to the completion of much-needed renovations at many area hotels. Occupancy remained flat in 2014; however, strong demand fueled by three large events in the metro area (the MLB All-Star Game, the Shriner’s Convention, and the U.S. Junior National Volleyball Championships) allowed hoteliers to push average rate by 6.4% in 2014, the highest growth since the recession. Despite significant layoffs at major employers, including Target and General Mills, data 2015 illustrate a positive trend, with a modest increase in occupancy and rate growth of 1.5% and 4.3%, respectively.
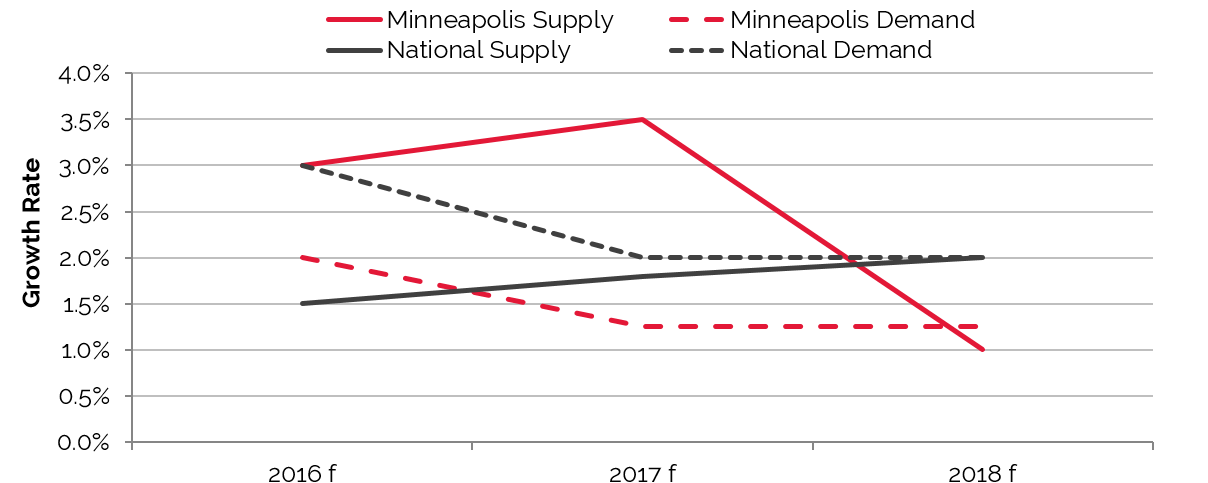
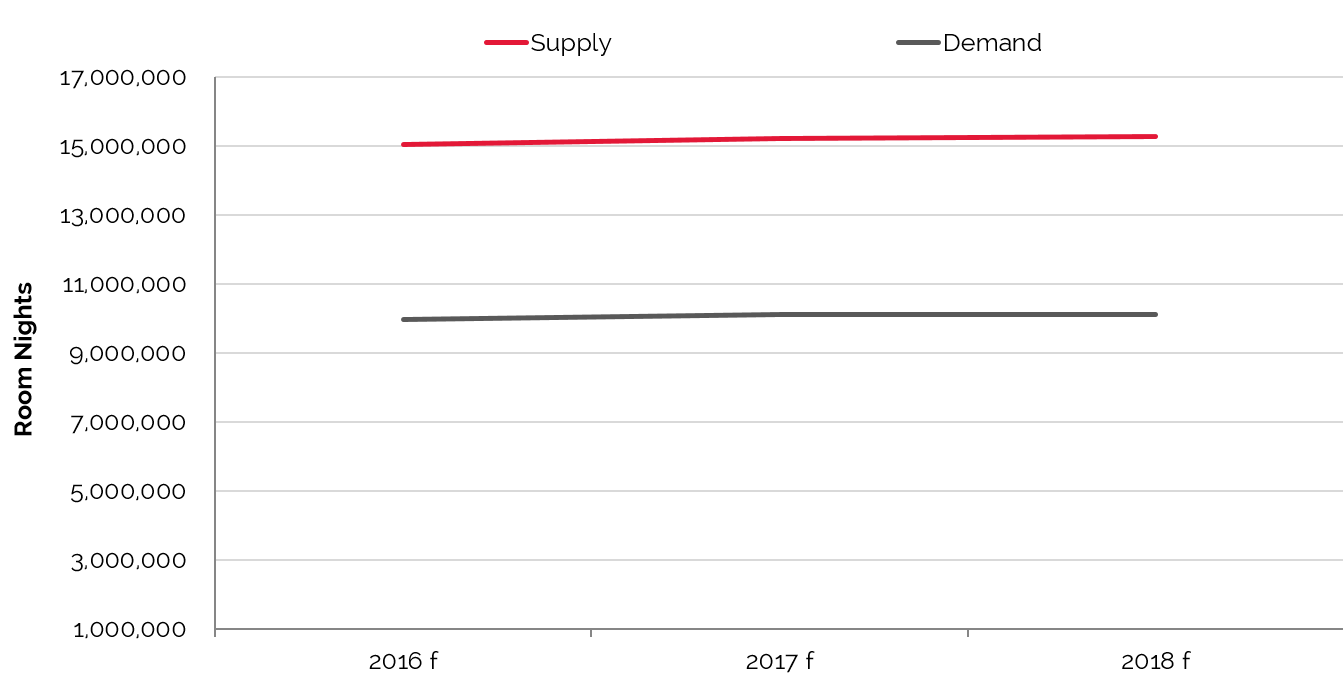
Minneapolis-St. Paul Supply and Demand to Reach Equilibrium in 2016
Source: HVS & STR
A significant amount of new supply is expected to enter the market in 2016 and 2017, which will likely have a negative, though minor, impact on market-wide occupancy. Research shows a moderate amount of unaccommodated demand related to corporate travelers during the midweek period, as well as group and leisure demand during peak summer months. The opening of the new hotels should allow the market to absorb this unaccommodated demand.
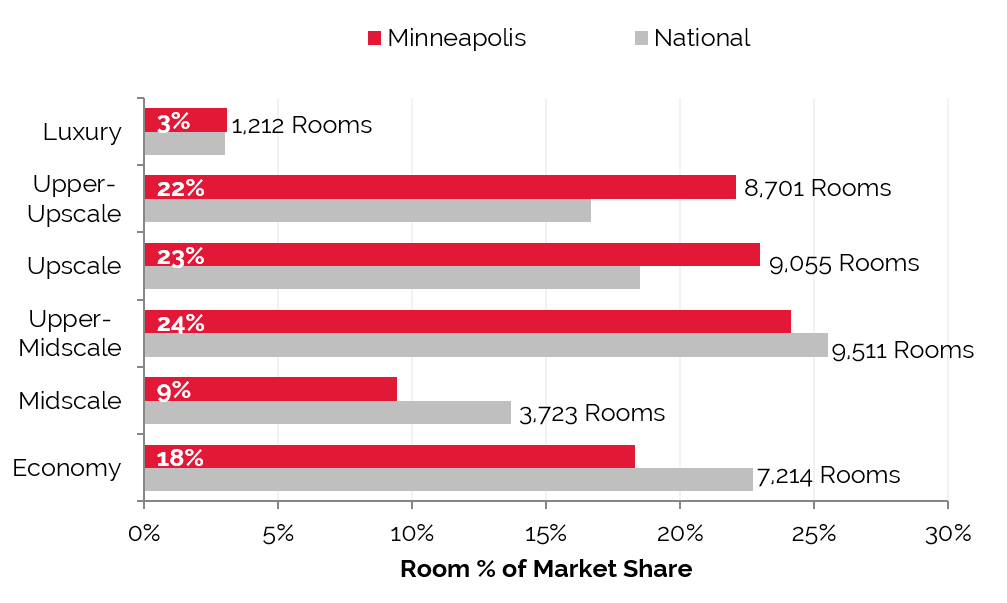
Existing Supply Breakdown by Brand and Scale
Of the six hotel classifications, upper-upscale and upscale represent the two categories of hotels in Minneapolis that surpass the national market share. However, midscale and economy hotels represent a much lower percentage of the market-wide total in Minneapolis-St. Paul when compared to the national average. As with many urban markets, a larger concentration of higher-rated hotels is expected, and Minneapolis-St. Paul is no different, given the limited amount of midscale and economy properties.
Upper-Midscale Hotels Constitute the Largest Portion of Rooms in Minneapolis, Similar to the Nation
Source: STR
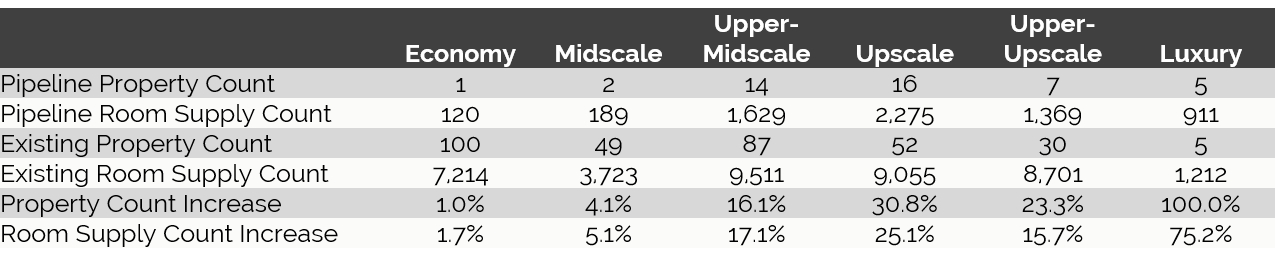
New Supply Pipeline
Upper-midscale and upper-upscale hotels are anticipated to dominate new hotel development in the Minneapolis-St. Paul area in the coming years, driven by the return of favorable financing, the evolution of new brands, and expanding commercial and leisure demand. This is especially apparent in the downtown and airport cores, which tend to generate demand related to higher-rated clientele. Developers are taking advantage of the higher rates that these hotels command given the number of travelers to Minneapolis-St. Paul with the means to pay for a centrally situated, higher-class hotel of rooms. In addition, several large hotel projects are occurring in conjunction with other major developments, such as the expansion of the Mall of America in Bloomington and upgrades to the Minneapolis-St. Paul International Airport.
The table below reflects an increase of approximately 7,100 rooms, plus proposed properties with an undetermined room count, in addition to the existing supply of 39,416 rooms in the metro area; the table also includes numerous planned projects in the city, representing an approximate supply increase of 18%.
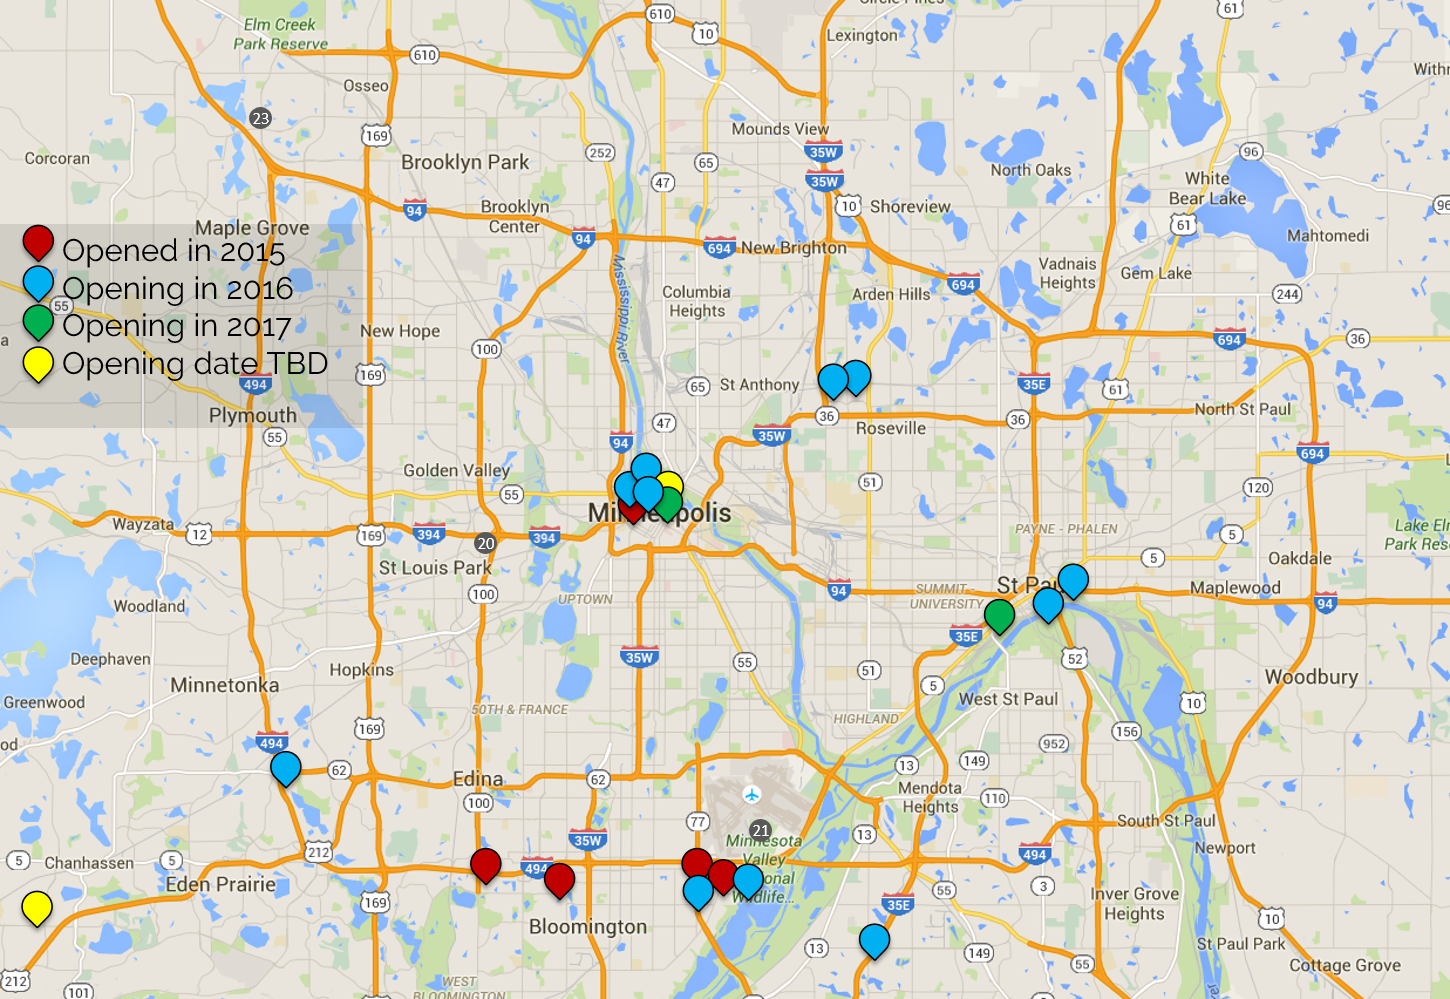
Majority of New Hotels are Expected to Open in the Minneapolis Central Business District
Source: HVS
Downtown Minneapolis, Downtown St. Paul, and Bloomington represent the three submarkets anticipated to receive the largest increase in new supply in the next three years.
Minneapolis’s Luxury Hotel Room Inventory set to Increase about 100%; Mid-Scale Inventory to Stabilize*†
Source: HVS, STR and BuildCentral, Inc.
* Only includes properties with room counts and class designations
† Only the lowest value in the rooms range is considered
Lodging Room Supply Expected to Increase 2016–2018
Source: HVS
Hotel Valuation Trends
The annual HVS Hotel Valuation Index (HVI) compiles data derived from over 4,500 hotel appraisal assignments each year, providing for analysis of performance and forecasts for hotel markets nationwide.
The Minneapolis-St. Paul hotel market achieved annual RevPAR growth of roughly 11% from 2011 through 2013. Market-wide occupancy surpassed 67% in 2014, and average rate registered over $107 for the same year. Prior to 2014, occupancy in Minneapolis-St. Paul had not surpassed 67% since 2000, and the city’s average daily rate has never been higher.
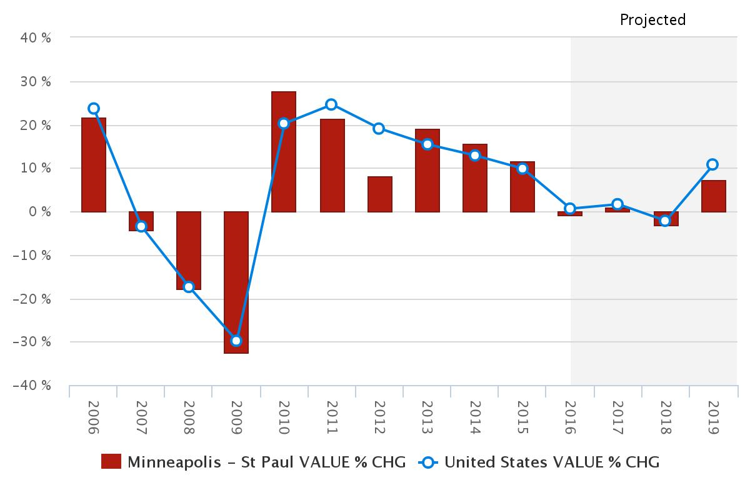
The HVI also provides insight into hotel values. In 2015, Minneapolis-St. Paul ranked in the top ten among 65 major U.S. cities in hotel value growth; hotel values in Minneapolis-St. Paul rose by 12% that year, also outpacing the nation as a whole. Minneapolis-St. Paul hotel values are anticipated to decline by another 1% in 2016, with a 4% growth rate between 2016 and 2019.
The following chart illustrates the trajectory of hotel values in Minneapolis-St. Paul from 2006 through 2019.
Minneapolis-St. Paul Hotel Values Rise Sharply in 2010 and 2011, with Growth Projected through 2019
Source: HVS & STR
Hotel Value Growth Expected to Outpace that of the Nation through 2018
Source: HVS & STR
Recent Hotel Transactions
The following table details confirmed hotel transactions in the greater Minneapolis-St. Paul market since 2013.
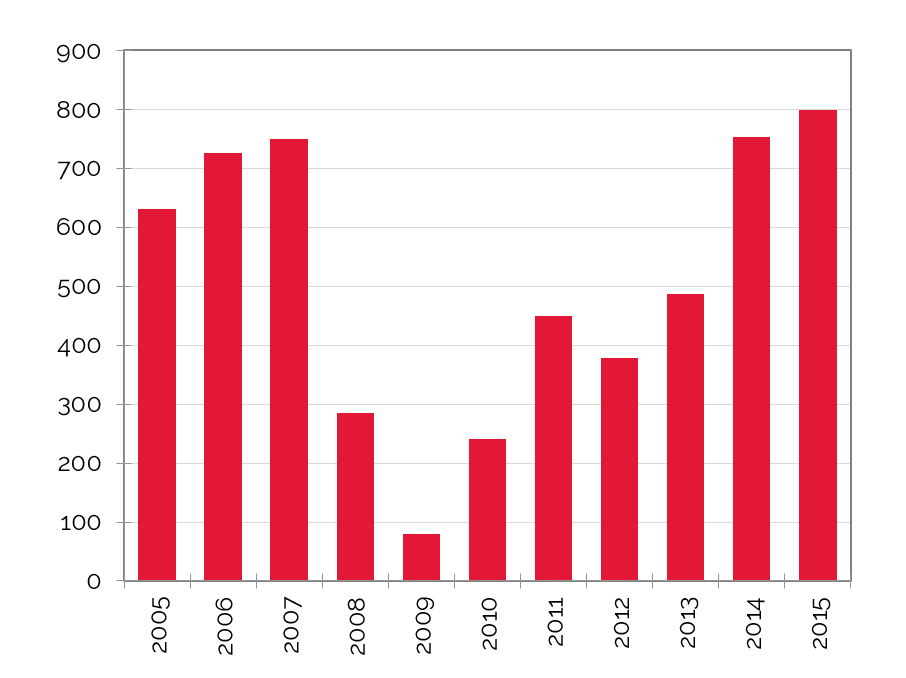
Minneapolis Realizes Highest Number of Major Hotel Sales, Highest Price per Room in the Greater Market
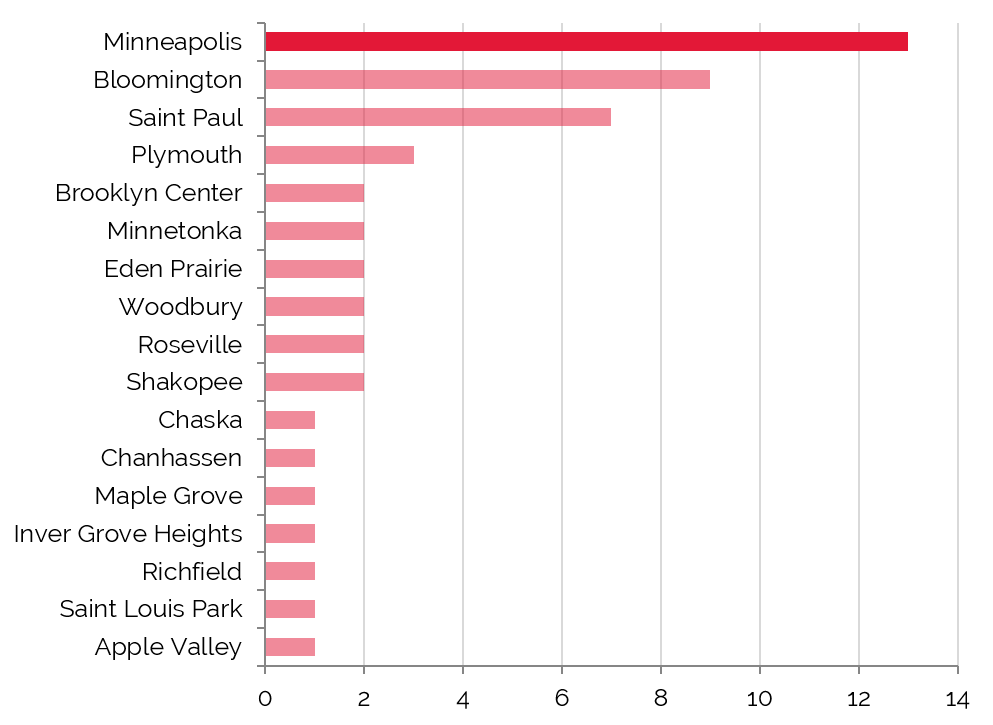
Number of Sales
Source: HVS & RCA
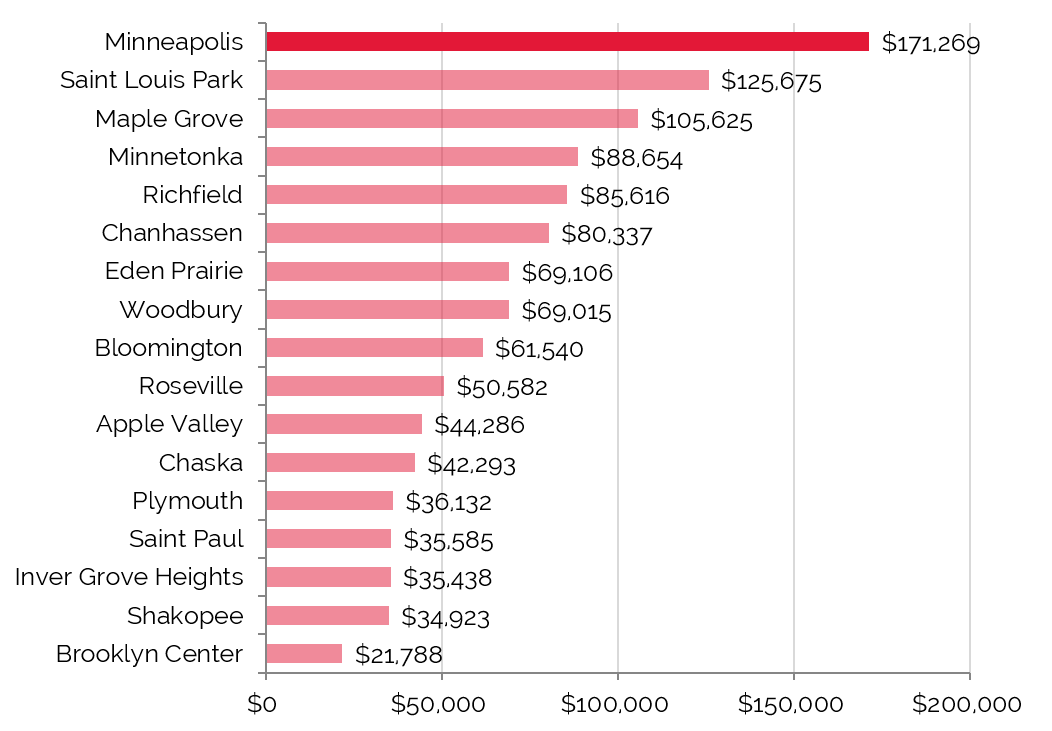
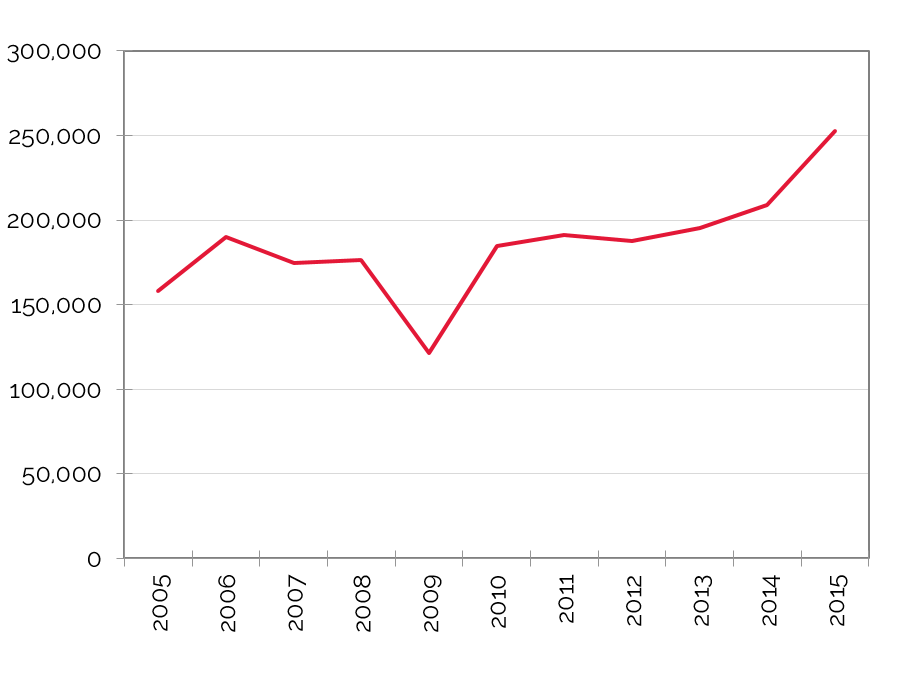
Average Price per Room
Source: HVS & RCA
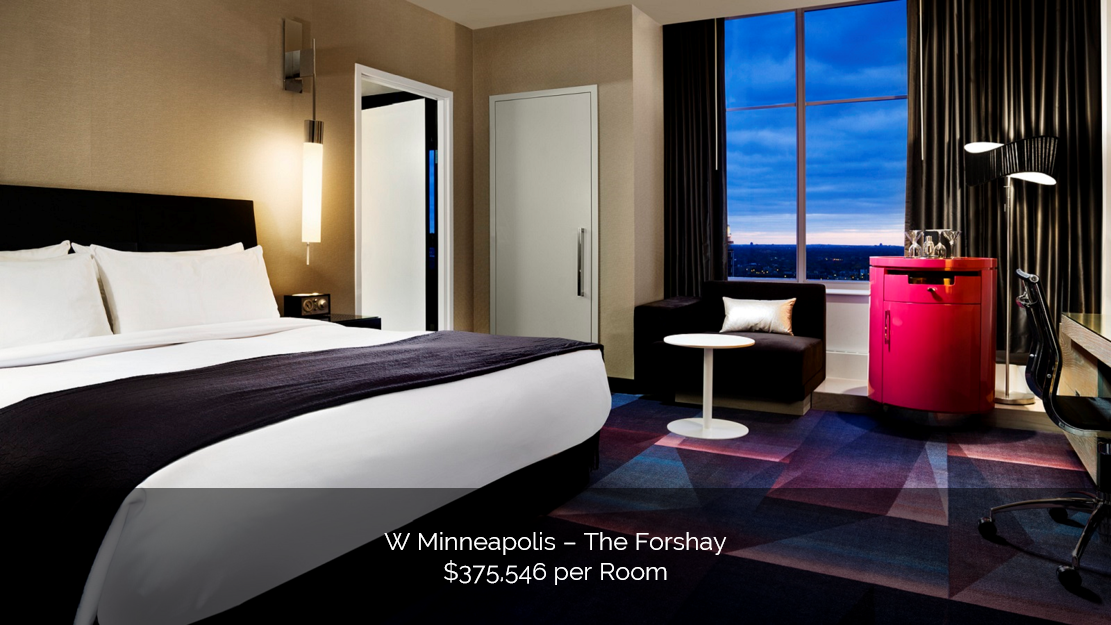
While transaction volume softened in 2014, the sales in 2015 indicate a strong pool of buyers in Minneapolis. Although sale prices have averaged nearly $85,000 per room since 2013, pricing is highly dependent on historical operations, location, product type, and if the property was under financial distress. The sales above, which total just over $945 million in transaction volume, include such high-profile assets as the W Minneapolis - The Foshay, whose estimated price of $86 million was the highest per-room price paid in the Minneapolis-St. Paul MSA.
Interest among investors remains high and continues to put downward pressure on capitalization rates, particularly in high barrier-to-entry submarkets such as Minneapolis and the Bloomington/I-494 corridor. The high level of investor interest, Minneapolis-St Paul’s thriving economy, and growing demand generated by the finance, manufacturing, healthcare, and consumer goods sectors support a positive outlook for the city’s hotel industry overall, with values set to rise through 2017.
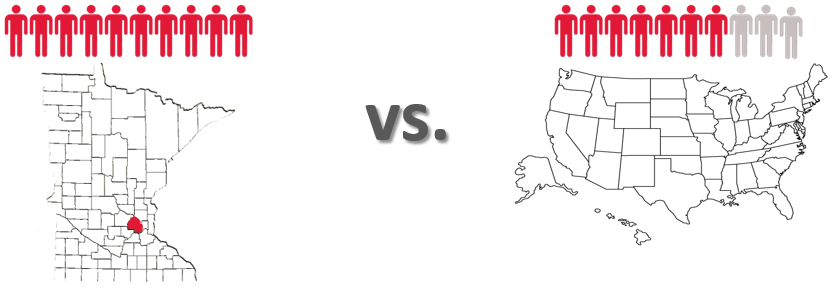
Number of Major U.S. Sales ($10M and above)
Average U.S. Key Price Per Room
Source: RCA
Key Economic Indicators
Economic and Demographic Review
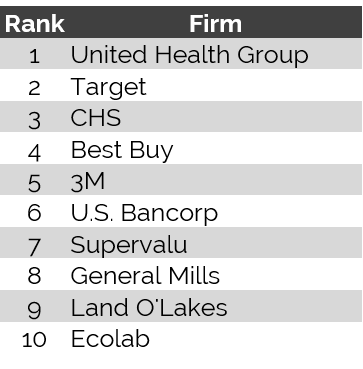
Famous for its abundance of waterways, as well as its legendary winters, the Minneapolis-St. Paul MSA is also home to the highest number of Fortune 500 companies per capita in the nation. Flour mills and the timber trade once dominated the area; however, in recent years, the Twin Cities market has flourished into one of the most successful and diverse economies in the country, as illustrated by the plethora of corporate headquarters including 3M, UnitedHealth Group, Target, Best Buy, Cargill, Ecolab, U.S. Bank, and General Mills. Residents are drawn to the area by these diverse employment sectors, along with Minneapolis-St. Paul’s educational institutions, short commute times, and parks and recreational attractions. These factors result in a high quality of life, and in spite of impediments brought on by harsh winter weather, Minneapolis was voted the healthiest city in the nation by Livibility.com in 2015.
Population growth in the Minneapolis-St. Paul MSA has been 30% higher than that of the nation
Per-capita personal income growth in the MSA matches that of the nation from 2010 to 2016
Source: Woods & Poole Economics, Inc.
The U.S. population grew at an average annual compounded rate of 0.9% from 2010 through 2015, and that rate is forecast to continue into 2020. For those same periods, Hennepin County’s population growth lagged behind the country at 0.7%, but the Minneapolis-St. Paul MSA exceeds the county, state, and nation with a compounded average annual growth rate of 1.2% from 2010 to 2015 and 1.3% into 2020. This growth rate is being spurred, in part, by strong job growth in the Minneapolis-St. Paul metro area, which will be discussed in more detail later in this report.
The average annual compounded growth rate of per-capita personal income for the county between 2010 and 2015 was 1.4%, versus 1.2% for the nation over the same period. Income in the county is expected to achieve 1.7% growth through 2020, versus 1.3% for the nation. Anticipated growth into 2020 for the Minneapolis-St. Paul MSA lags slightly behind at 1.2%.
The national wealth index for the country trended flat from 2000 to 2015; it is anticipated to remain flat into 2020. The MSA is expected to experience a slight contraction of -0.1% over the next five years.
Food and beverage sales in the county grew at an annual compounded rate of 1.6%, with $2.5 billion in 2010 and $2.7 billion in 2015. Through 2020, the pace of growth is expected to moderate slightly to 1.0% for the county. The Minneapolis-St. Paul MSA reflected more robust sales, with $5.18 billion in 2010, $5.78 billion in 2015, and a predicted $6.33 billion in sales in 2020. This reflects average annual compounded growth rates of 2.2% from 2010 to 2015 and 1.9% from 2015 to 2020, which is comparable to the growth rate anticipated for the nation.
The retail sales sector in the Minneapolis-St. Paul MSA again outpaced that of the county. The MSA demonstrated an average annual compounded growth rate of 2.7%, with $49.4 billion in sales in 2010 and $56.5 billion in 2015. This sector is expected to remain strong, achieving 2.1% growth into 2020, versus 2.0% for the nation.
Radial Economic Indicators
The following table reflects radial demographic trends for the Minneapolis-St. Paul market area measured by three points of distance from the center of Downtown Minneapolis.
Demographics by Radius from the Center of Minneapolis
Population Growth to Decline within Five-Mile Radius 2016–2021

Source: The Nielsen Company
Household Growth to Increase within One-Mile Radius 2016–2021

Source: The Nielsen Company
Source: The Nielsen Company
Top Five Occupations – Estimated for 2015
Within One-Mile Radius

Within Five-Mile Radius

Within Ten-Mile Radius

Source: The Nielsen Company
Population growth within one mile of the center of Downtown Minneapolis was a significant 18% between 2000 and 2010, whereas the greater area experienced a decrease of 0.1% during this same time period. Although the overall growth rate slowed to 15% from 2010 to 2016, projected growth is anticipated to continue at about 8% between 2016 and 2021. Households are expected to grow at a rate of nearly 9.0% per year into 2021. According to data published by the City of Minneapolis, the number of new residential permits in the greater metro area was estimated at 2,799 units in the second quarter of 2015, up more than 1,300 from the prior quarter, but down slightly from the same period in 2014. The third quarter of 2014 represented a peak for the metro area, with 3,014 new residential permits issued.
Minneapolis’s forecasted 2015 average and median household incomes, skewed low because of the large number of University of Minnesota students, are strong in comparison with other Minnesota cities, and generally on par with the national average.
Forecast for 2015 - Average and Median Household Income
Source: Nielson Company
Workforce Characteristics
The characteristics of an area’s workforce provide an indication of the type and amount of transient visitation likely to be generated by local businesses. Sectors such as finance, insurance, and real estate [FIRE]; wholesale trade; and services produce a considerable number of visitors who are not particularly rate-sensitive. The government sector often generates transient room nights, but per-diem reimbursement allowances often limit the accommodations selection to budget and mid-priced lodging facilities. Contributions from manufacturing, construction, transportation, communications, and public utilities [TCPU] employers can also be important, depending on the company type.
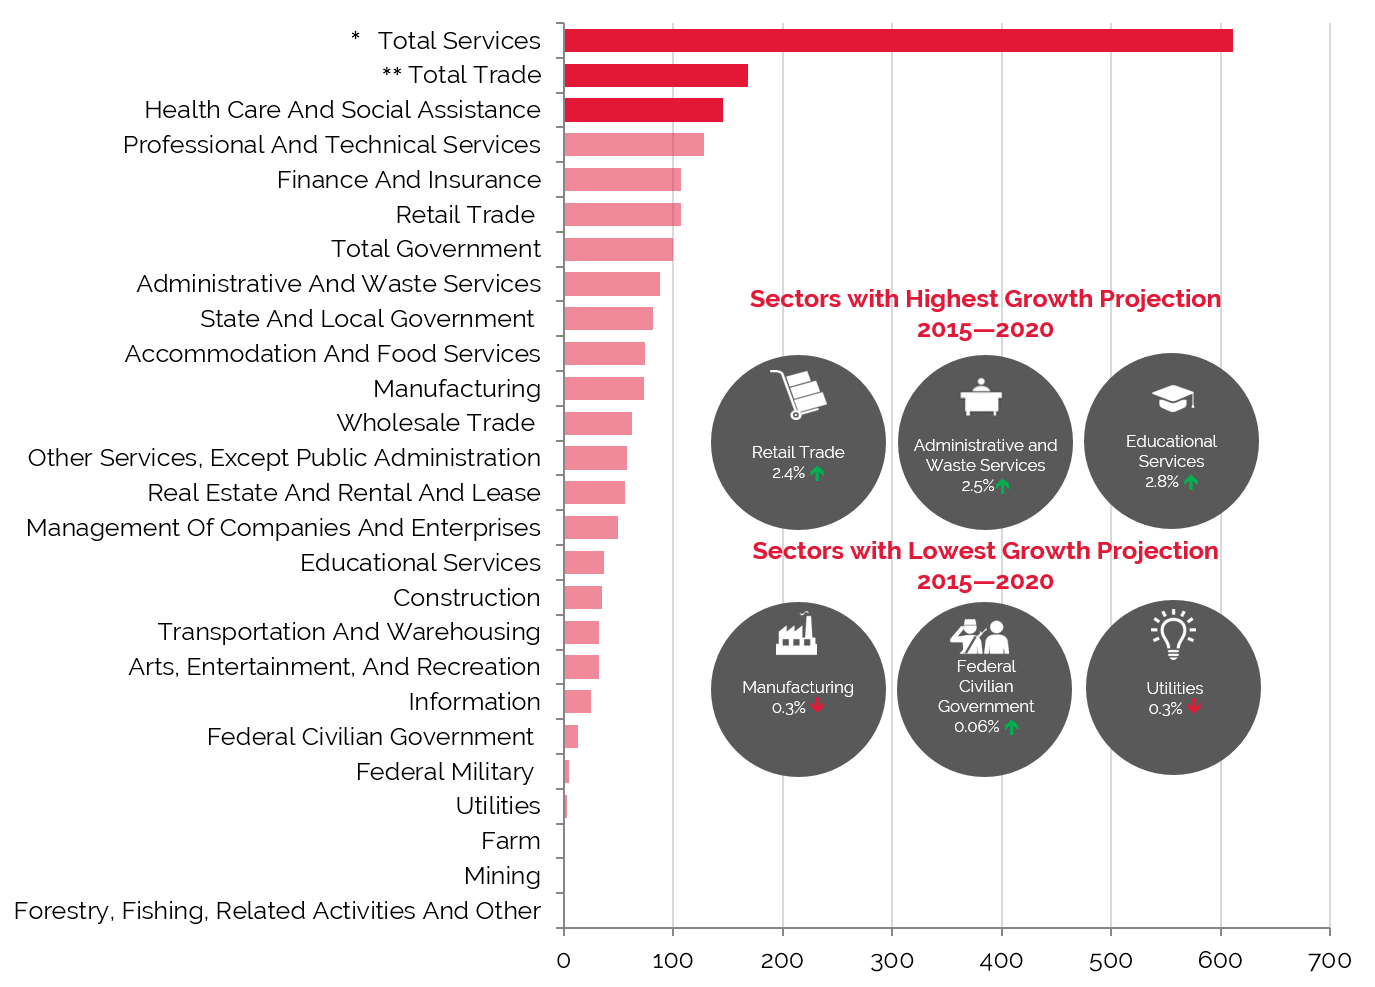
Employment Projections through 2020 Show Impressive Growth in Total Services, Real Estate, and Retail Trade
Source: Woods & Poole Economics, Inc.
* Total Services include: Professional and Technical Services; Management of Companies and Enterprises; Administrative and Waste Services; Educational Services; Healthcare and Social Assistance; Arts, Entertainment, and Recreation; Accommodation and Food Services; and Other Services, except Public Administration
** Total Trade includes Wholesale Trade and Retail Trade
Woods & Poole Economics, Inc. reports that from 2000 to 2010, total employment in the MSA grew at an average annual rate of 0.3%. This rate was below the growth rate of the nation. The pace of employment growth in the county increased moderately to 1.8% on an annual average from 2010 to 2015. Woods & Poole Economics, Inc. anticipates total employment in the MSA to grow by 1.6% on average annually through 2020. This trend is 23% more robust than the forecasted rate of change of 1.3% for the U.S. as a whole. Notably, the MSA boasts the highest labor participation rate among 30 major metropolitan areas, according to the Greater Minneapolis St. Paul Regional Economic Development Partnership.
Medical technologies is one of the fastest-growing sectors in the metro area, led by powerful advancements from companies including Medtronic, 3M, Boston Scientific, and fueled by research and development at the University of Minnesota and Mayo Clinic. The largest primary sector was Total Services, which recorded the highest increase in number of employees during the period from 2010 to 2015; employment in Total Services grew by approximately 99,400 people, or 2.4%. The services employment sector represented 49.1% of total employment in the Minneapolis-St. Paul MSA in 2015, with an average annual compounded growth rate expected to be approximately 2.1% into 2020. Of the various sub-sectors included in Total Services, Health Care and Social Assistance and Professional and Technical Services were the largest employers. Total trade was the second-largest industry, comprising 13.6% of total employment in the MSA; these sectors are important drivers of demand to higher-rated hotels.
The growth rate of the Total Government sector, a room-night driver for economy hotels, has been slowly contracting from 0.6% for the decade preceding 2010, to -0.1% from 2010 to 2015, to an anticipated 0.1% into 2020. However, the sector accounts for up to 8.8% of total employment in the MSA.
Employment
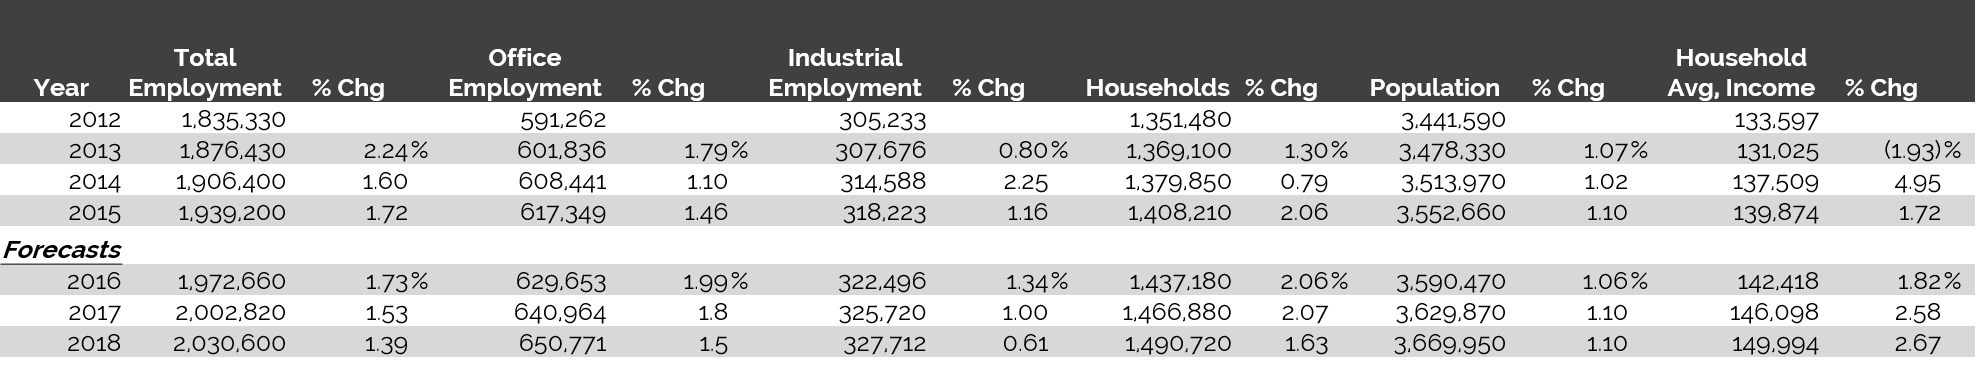
Minneapolis-St. Paul’s collection of businesses, entertainment venues, historical attractions, and colleges and universities serve as a platform for the city’s diverse workforce. Government jobs and investments related to state, city, county, and federal entities provide a solid economic base for the area. In addition, the University of Minnesota has continually supplied the local labor pool with young, well-educated, and relatively inexpensive workers. The following table illustrates historical and projected employment, population, and income data for the overall Minneapolis-St. Paul market as presented by REIS.
Historical & Projected Employment, Households, Population, and Household Income Statistics for Minneapolis-St. Paul
Source: REIS Report, 1st Quarter, 2016
Top Industries In Minneapolis
Minneapolis-St. Paul remains one of the most cost-efficient places to live and do business in the United States. Its combination of big-city business amenities and small-market ease of living has historically made the metro area a magnet for investment. The healthcare sector in the area is regularly recognized for advancements made in the medical field. Several high-tech and pharmaceutical companies support the area’s medical industry by offering the latest state-of-the-art equipment and medicines. Allina Health operates 90 clinics, 13 hospitals, and numerous pharmacies and specialty centers in Minnesota and western Wisconsin. HealthPartners is a major employer in the area, providing quality healthcare for tens of thousands of members in Minnesota and western Wisconsin. HealthPartners is the largest consumer-governed, nonprofit healthcare organization in the nation.
UnitedHealth Group (UHG) is another major healthcare-related employer in the greater Minneapolis area. UHG provides network-based healthcare benefits and technology-enabled health services to more than 85 million consumers under two platforms, UnitedHealthcare and Optum. UnitedHealth Group has been constructing a new corporate campus in phases near the Minnetonka/Eden Prairie border, and the company will be consolidating all of its operations to this location in the next few years.
The University of Minnesota Medical Center Fairview is an 800-bed, general medical and surgical facility with more than 34,000 annual admissions. In addition, the University of Minnesota Masonic Children's Hospital hosts a broad range of pediatric programs including surgery, cardiac care, oncology services, and organ transplantation. This facility performed the first successful pediatric blood-marrow transplant, the first successful infant heart transplant in Minnesota, and the first pediatric cochlear-ear-implant surgery. Furthermore, the 330,000-square-foot, $160-million University of Minnesota Ambulatory Care Center is currently under construction, with a January 2016 completion date.
The University of Minnesota, located on two campuses in the cities of Minneapolis and St. Paul, had an enrollment of 51,147 students in the fall of 2014. The university is highly regarded as one of the top-funded research institutions in the United States. In January 2013, the University of Minnesota was named a Best Value Public College by Kiplinger's Personal Finance and was ranked in the top 25 public colleges by Forbes in 2014. Significant university milestones include the first successful human bone-marrow transplant, the first successful open-heart surgery, and the first wearable artificial pacemaker.
Diversity among employers and demand generators has allowed hotels in the metro area to ride out the impacts and aftershocks of the recession. Financial institutions based in the metro area include U.S. Bancorp, Wells Fargo, Ameriprise Financial, and TCF Financial Corporation, most of which are located in Downtown Minneapolis. TCF will be relocating a large portion of its operations from Downtown Minneapolis to Plymouth by the end of 2015, and Wells Fargo will be relocating 5,000 employees into 1.1 million square feet of new office space in Downtown East in 2016. One of the markets’s most recognized major employers, Target, recently laid off 2,360 U.S. employees, 1,700 of which were at its corporate headquarters in Minneapolis. In Downtown St. Paul, major employer Ecolab recently acquired the Traveler’s Insurance building and will slowly relocate its headquarters to this building as leases expire in other downtown buildings. Large employers based out of the suburbs include 3M, SUPERVALU, General Mills, Cargill, Best Buy, and Medtronic. In addition, Amazon is in the process of building a distribution center in Shakopee that will eventually employ 1,000 people. An attractive cost of living, quality of life, and a highly skilled workforce will continue to fuel the metro area’s already strong economic growth.
The following table presents a list of the major employers in the market:
Major Fortune 500 Employers in Minneapolis-St. Paul
Source: Greater MSP
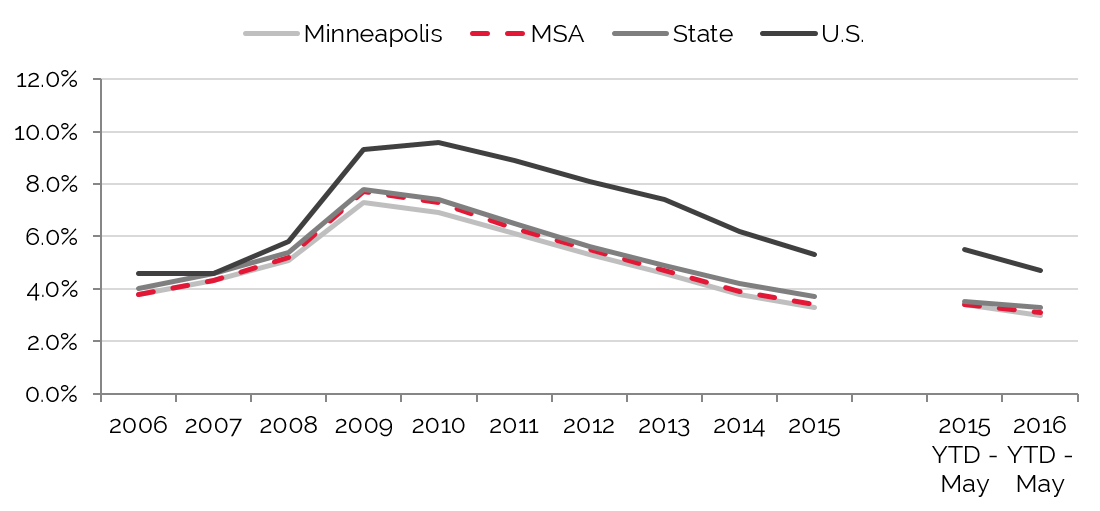
Unemployment
After showing year-over-year improvement, unemployment began to rise in 2008, concurrent with the onset of the recession, and the 2009 unemployment rate increased further. However, unemployment declined in 2010 as the economy rebounded, a trend that continued through 2015. The most recent comparative period illustrates improvement for the MSA and state unemployment levels, as indicated by the lower unemployment rate in the latest available data for 2016; the county's unemployment rate reflects stability. Reportedly, local employment has remained strong within the healthcare, consumer services, and technology sectors, including healthy employment levels at major employers such as Wells Fargo, Cargill, and Medtronic.
Minneapolis-St. Paul Unemployment Stands Well Below National Trends
Source: U.S. Bureau of Labor Statistics
According to Wells Fargo’s Economic Outlook, as of the fourth quarter of 2014, the metro area boasted just 1.1 unemployed persons for every job opening. The limited pool of applicants has led to a tight labor market, which is expected to increase retail and residential sales.
Office Space
Trends in occupied office space are typically among the most reliable indicators of lodging demand, as firms that occupy office space often exhibit a strong propensity to attract commercial visitors. Thus, trends that cause changes in vacancy rates or in the amount of occupied office space may have a proportional impact on commercial lodging demand and a less direct effect on meeting demand.
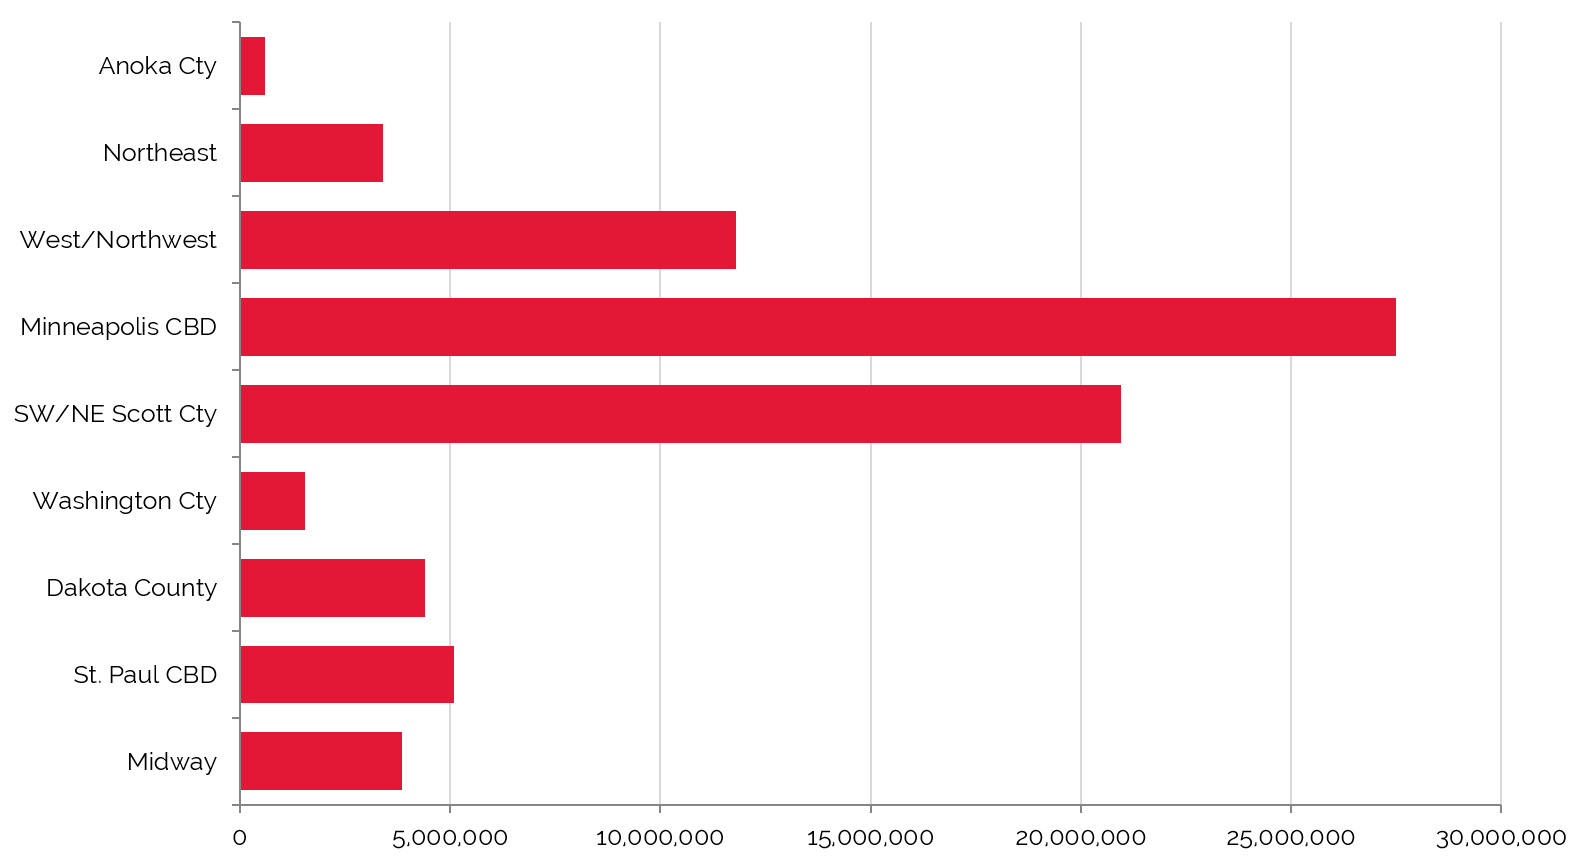
Minneapolis-St. Paul’s 79.2 million square feet of office space had an overall vacancy rate of 16.1% and an average asking rent of $22.73 for the first quarter of 2016. Minneapolis-St. Paul’s abundance of Class A office space has made the city one of the most desirable in the Midwest; revitalization efforts throughout the two CBDs and other areas have also helped make the area attractive to office tenants. With the most rentable square feet among all of the metro area's submarkets, as well as a low vacancy rate and the highest rental rates, the Minneapolis CBD office submarket stands out as a hub for much of the city's growth and demand. High demand, in fact, has made it very difficult to obtain Class A space within the Minneapolis CBD submarket, thus driving additional office development projects.
CBD Submarket Features the Most Office Space in Minneapolis
Source: REIS Reports, 1st Quarter, 2016
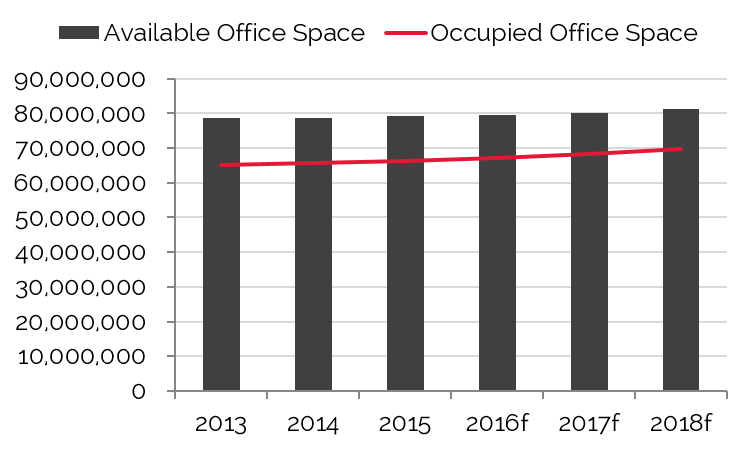
The inventory of office space in the Minneapolis-St. Paul market increased at a modest average annual compound rate of 0.3% from 2002 through 2014, while occupied office space grew at an average annual rate of 0.5% over the same period. The market’s strength is evident in the 1.1% average annual change in occupied office space from 2010 to 2014. From 2014 to 2019, the inventory of occupied office space is forecast to increase at an average annual compound rate of 1.3%, with available office space expected to increase 2.1%; this would result in an anticipated vacancy rate of 13.3% as of 2019, the lowest level in a decade.
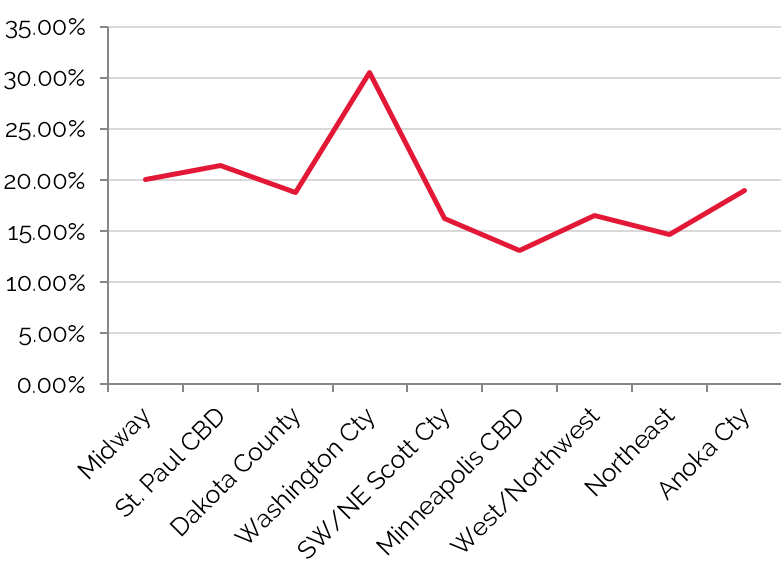
CBD Exhibits the Lowest Vacancy Rate
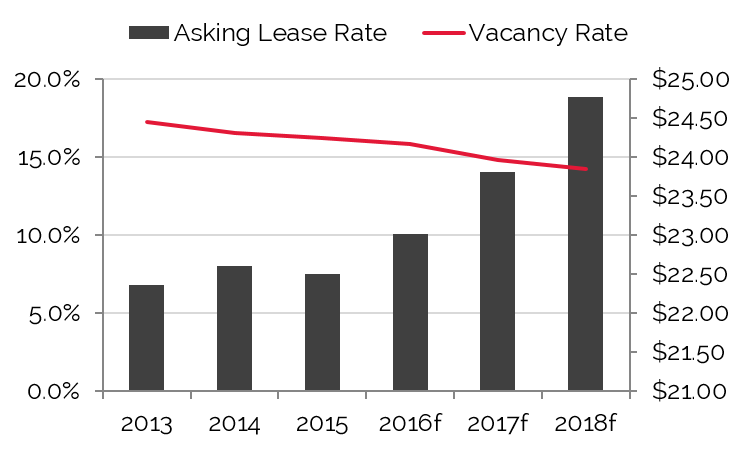
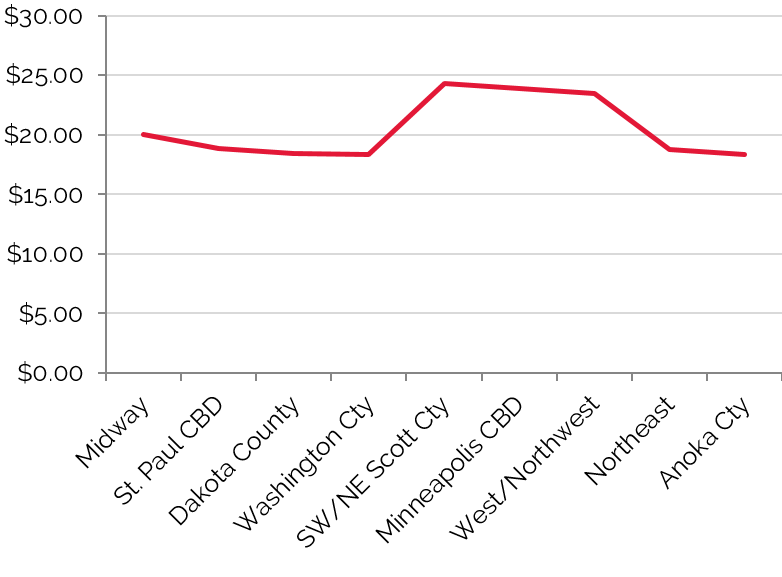
SW Minneapolis/NE Scott County Boasts the Market’s Highest Average Asking Lease Rate
Source: REIS Reports, 1st Quarter, 2016
Available and Occupied Office Space Both Rising with Increasing Demand, Asking Lease Rate Increases as Vacancy Rate Drops
Source: REIS Reports, 1st Quarter, 2016
The 4.5 million square feet of new space over the next five years in the metro area should be quickly absorbed, and the recent increase in lease rates is expected to continue, surpassing inflationary levels by 2018.
Convention Activity
Convention centers generate significant levels of demand for area hotels, particularly those within a radius of three miles. Convention headquarters hotels command premium rates and, in addition to capturing event-related demand, can also benefit from hosting related banquet events. Major conventions also push demand to peripheral hotels in the market.

The Minneapolis Convention Center, located in the heart of Downtown, hosts events for clientele ranging from local groups to international conventions. The Minneapolis Convention Center contains more than one million square feet of space and covers four city blocks. With nearly 500,000 square feet of exhibit space, 87 column-free meeting rooms, and 2 large ballrooms, the facility can comfortably accommodate 50,000 attendees. The convention center also features a 100,000-square-foot exhibit hall that can be converted into a ballroom.
Consistent with national trends, the number of events declined in 2008 and 2009; however, the number of delegates attending conventions and other events increased during those years. In 2010, both the number of conventions and attendees increased significantly, but the city’s convention activity modestly decreased in 2011. This downward trend was reversed in 2012, with both the number of events and attendees rising once again. While the number of events increased by almost 19% in 2013, the number of delegates remained flat. The number of events and total delegates increased significantly in 2015; the boost in delegate count was largely brought on by the Major League Baseball All-Star Game. The facility's mid-market price point is an advantageous attribute that should continue to support convention demand in the near future.
The Saint Paul RiverCentre is a state-of-the-art convention, special event, and entertainment facility. The facility offers 15 meeting rooms, a 27,000-square-foot Grand Ballroom, and nearly 100,000 square feet of exhibition space. The complex includes the Legendary Roy Wilkins Auditorium, a multi-purpose facility that hosts a variety of events including conventions, trade shows, consumer shows, concerts, and sporting events. The auditorium has permanent seating for 5,500 people and offers 30,000 square feet of exhibition space. Collectively, the auditorium can be used in conjunction with the RiverCentre for increased exhibition space.
The Xcel Energy Center is a sports and entertainment facility encompassing more than 650,000 square feet of space; the center serves as home to the NHL's Minnesota Wild professional hockey team and also hosts a variety of special events and concerts. The venue offers 18,000 seats, 74 executive suites, state-of-the-art technology, and outstanding acoustics for special events and concerts. Representatives in the market noted that the convention center has gone largely under-utilized from a true, second-tier convention standpoint; however, the incorporation of the Xcel Energy Center into the RiverCentre convention complex has reportedly created increases in room-night demand derived from concerts and special events hosted at the venue, above and beyond the typical hockey season's generation of room nights associated with game nights.
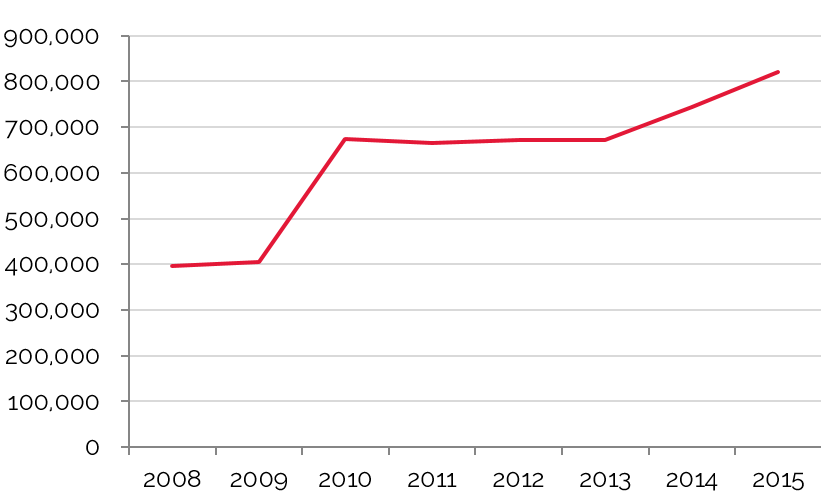
Convention-Generated Room Nights Peak in 2015
Source: Minneapolis Convention Center
Airport Traffic
Airport passenger counts are important indicators of lodging demand. Depending on the type of service provided by a particular airfield, a sizable percentage of arriving passengers may require hotel accommodations. Trends showing changes in passenger counts also reflect local business activity and the overall economic health of the area.
The Minneapolis-St. Paul International Airport (MSP) is located seven miles southeast of Downtown Minneapolis and about seven miles southwest of Downtown St. Paul. The airport is serviced by major commercial airlines, as well as numerous charter and cargo carriers. Virtually every aspect of the airport was improved through a $3.2-billion expansion effort over the last decade. In 2002, the Metropolitan Airports Commission (MAC) opened two new Lindbergh Terminal concourses, A and B, and a second-phase expansion of Concourse C. MAC also opened the Humphrey Terminal and an eight-story parking ramp at the Humphrey Terminal, developed new cargo facilities, and finished work on numerous airfield projects. A fourth runway opened in 2005, and a 4,300-space parking structure was completed in 2008. Twenty-two charging stations, equipped with four electrical outlets each, are now available at no charge to travelers at both the Lindbergh and Humphrey terminals.
In September 2012, MAC presented its environmental assessment for the airport's proposed $1.5-billion expansion to support continued passenger growth through 2020. Federal approval of the assessment is required before the MAC can proceed with any expansion. The airport's long-term comprehensive plan calls for a major expansion of the terminal facilities. The plan is designed to increase gate capacity as warranted by passenger demand; however, no timeline or design has been finalized. The MAC recently selected Graves Hospitality for the development of a luxury, full-service hotel at the Lindbergh Terminal.
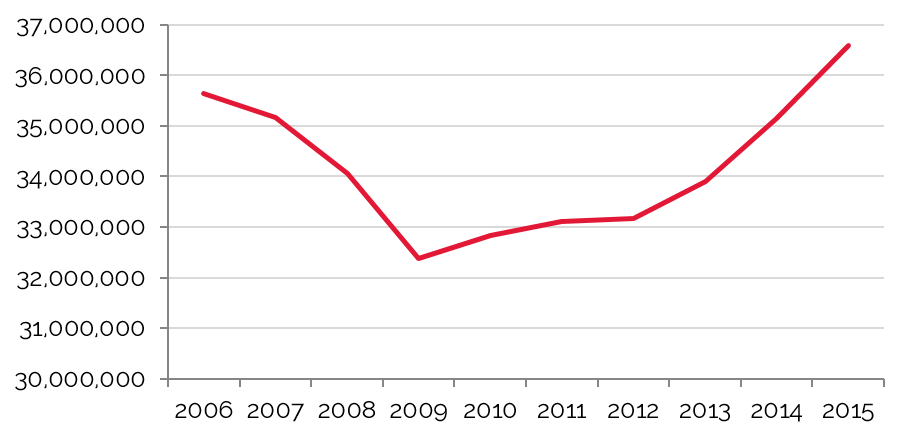
In the past decade, passenger traffic through Minneapolis-St. Paul has declined by 0.8% on an average annual basis, partially because of the merger of Northwest Airlines with Delta in 2009. Traffic has remained steady in recent years, and year-to-date May 2016 recorded roughly 534,000 more passengers than the same period in 2015.
A Long-Term Comprehensive Plan for Expansion of Terminal Facilities Should Help Restore Passenger Traffic at MSP
Source: Minneapolis-St. Paul International Airport
Tourist Attractions
The Twin Cities area is well known for its extensive theater and live-performance art offerings, world-class shopping, and eclectic dining venues. The market benefits from a wide variety of tourist and leisure attractions popular with families visiting from out of town, locals, and international visitors. The peak season for tourism is from May to September. During other times of the year, weekend demand comprises travelers passing through en route to other destinations, people visiting friends or relatives, and other weekend demand generators.
The 4.2-million-square-foot Mall of America complex attracts more than 40 million visitors a year. Up to 40% of these visitors live farther than 150 miles from the complex; hence, mall visitation supports a substantial number of room nights in the market. Construction began on Phase 1C of the expansion in July 2014; this phase includes a 342-room JW Marriott hotel, an office tower, and 135,000 square feet of retail space. The JW Marriott opened in November 2015, and the remainder of Phase 1C construction is anticipated to be completed by early 2016. Additionally, a 500-room Radisson Blu hotel opened on March 15, 2013, at the south end of the mall. An announcement was made on October 1, 2015, that plans for an additional 1,000,000-square-foot expansion were submitted to the City of Bloomington that would potentially include 580,000 square feet of retail space, a 180-room luxury hotel, 120 residential units, 168,000 square feet of office space, and 600 to 650 parking spaces. This complex will be known as the Collections at MOA.
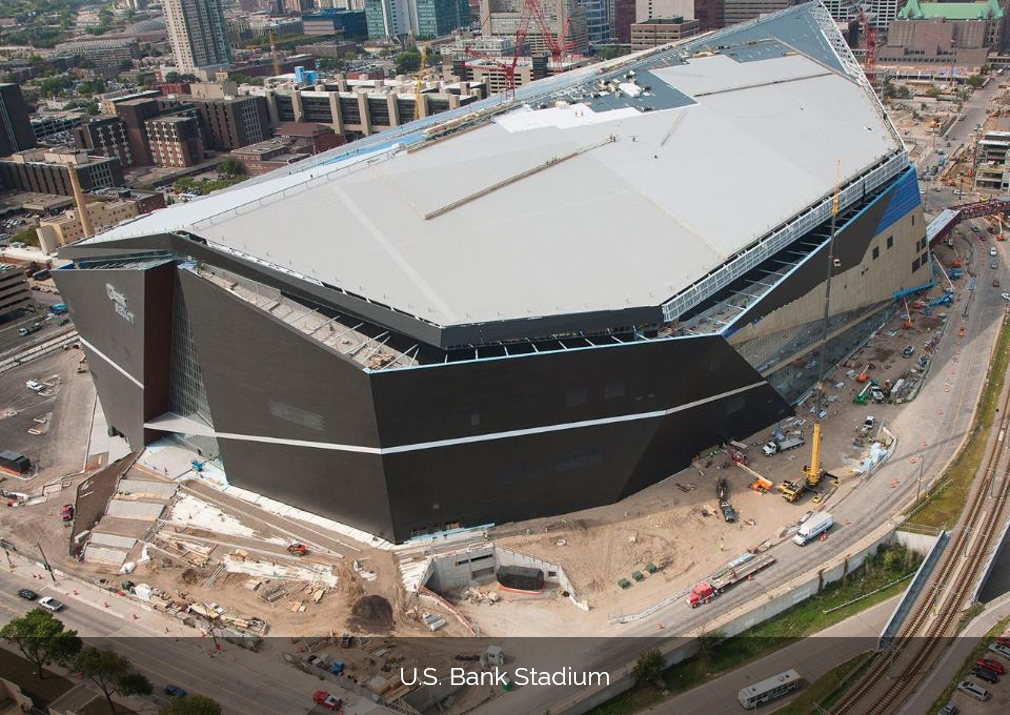
Sporting events are a major attraction in the Twin Cities area. Construction of a new $1.1-billion U.S. Bank Stadium began in January 2014, with the facility expected to open for the 2016 football season. In the interim years, the NFL’s Minnesota Vikings play at TCF Bank Stadium on the University of Minnesota campus. The new stadium will host Super Bowl LII in 2018 and the NCAA Final Four in 2019. The Target Center, located in Downtown Minneapolis, is currently undergoing a $97-million renovation; it is home to the NBA's Minnesota Timberwolves and the WNBA's Minnesota Lynx. The Xcel Energy Center in St. Paul is home to the NHL's Minnesota Wild and the NLL's Minnesota Swarm, and is also a premier location for concerts, shows, and athletic tournaments. In 2010, the Minnesota Twins Major League Baseball team began the season in its new home, Target Field, an open-air ballpark featuring 39,500 seats. This venue hosted the 2014 All-Star Game in July. In addition, Minneapolis and St. Paul are currently being considered for a major league soccer franchise.
The Twin Cities represent the third-largest theater market in the country. The $125-million, 285,000-square-foot Guthrie Theater, a Tony Award-winning center for theater performance, production, education, and professional training, is located in the historic Mills District on the banks of the Mississippi River in Downtown Minneapolis. Other popular venues include the State Theater and the historic Orpheum Theatre in Minneapolis, and the Fitzgerald Theater and the Ordway Center for the Performing Arts in St. Paul. The Ordway recently completed a $42-million expansion and renovation.
Closing Remarks
Growth is evident in Minneapolis-St. Paul. The population is increasing in line with the national average, unemployment is at an all-time low, and hotel occupancy has hit a record high. Healthcare, finance, government, and consumer-goods employers have prospered in the Twin Cities, and their longevity contributes to the widely recognized high quality of life in the area. New office developments in Downtown Minneapolis and along the I-494 corridor are expected to be quickly absorbed as office vacancy continues to decline, and new developments at major tourism attractions such as the U.S. Bank Stadium and Mall of America also testify to confident investment in the market. All of these projects bode well for a rise in commercial, group, and leisure demand within the Twin Cities.
While new hotel development could cut into Minneapolis-St. Paul’s trend of strong occupancy gains in the near term, all signs point to further growth in demand, particularly in 2018 with the hosting of the Super Bowl. In the meantime, the area’s economic anchors continue to support residents, visitors, businesses, and hotels, and the overall prospects for the market’s economy and hotel industry remain positive for 2016 and beyond.