Austin, capital of Texas, is a cultural, political, educational, and economic power center for the region. Federal, state, and local government operations, one of the nation’s largest and highest-ranked universities, and a stable of global businesses ranging from Apple to Whole Foods Market anchor the city’s economy. The “Live Music Capital of the World” also offers world-famous events and productions such as the South by Southwest (SXSW) music festival, which attracts performers from all over the globe, and, more recently, Formula 1 racing and ESPN’s X Games.

Austin earned the nickname “Silicon Hills” in the 1990s and has seen a massive influx and expansion of high-tech manufacturers, designers, and research and development centers. The high-tech industry in Austin has become a cornerstone of the area’s economy, with companies such as Dell, AMD, Apple, eBay, Facebook, Google, IBM, Intel, Texas Instruments, and 3M operating or headquartered in the city. As such, job growth in the Austin-Round Rock MSA, especially with respect to highly skilled, highly educated positions, ranks among the best in the nation.
Demand generated by the diversity of economic drivers in Austin, from popular culture to high-tech industry, provides a healthy, vibrant market for the city’s hotels. The following HVS In Focus report details recent performance and market trends relevant to the Austin hotel industry, as well as data and forecasts that can assist hotel stakeholders with buying, selling, and holding opportunities.
Hotel Market Performance and Forecast
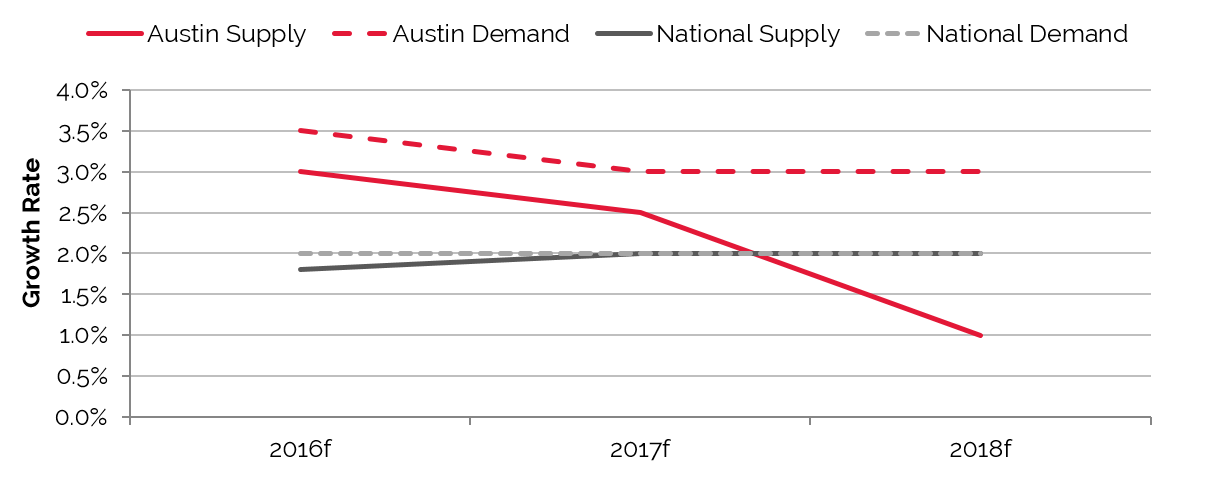
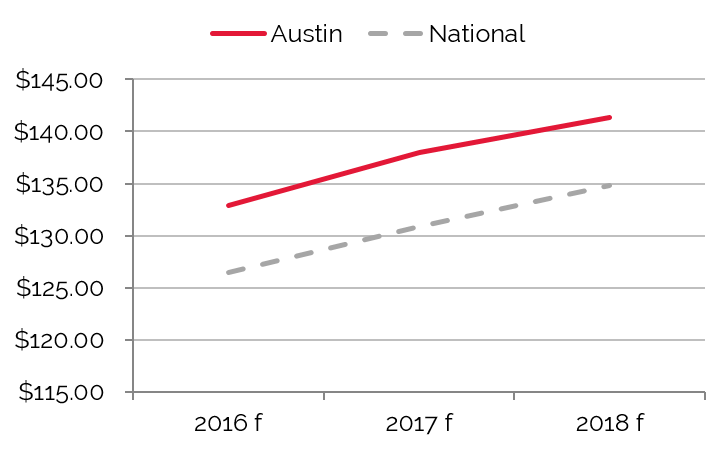
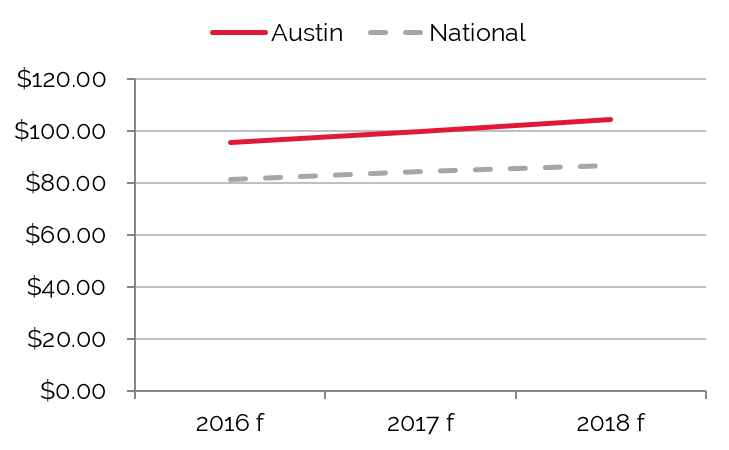
The following charts illustrate trends in forecasted hotel supply, demand, occupancy, and average rate for Austin hotels from 2016 to 2018.
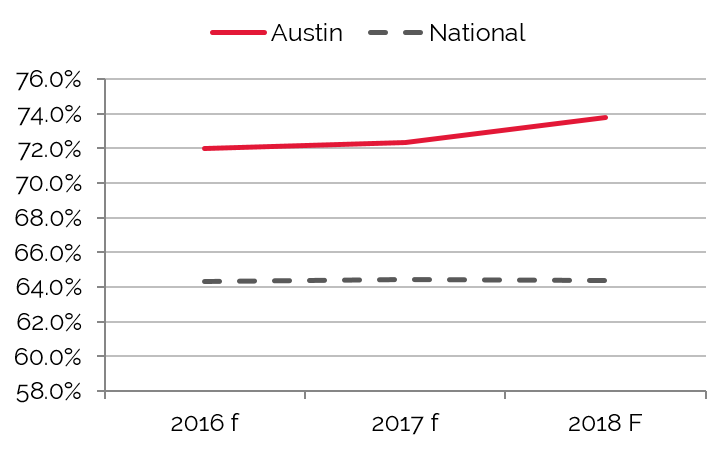
Occupancy to Stabilize, while Average Rate and RevPAR Forecast to Continue Growth
Austin’s Occupancy Declined in 2015
Nation Outpaced by Austin’s ADR
Austin’s RevPAR Soars Ahead of Nation
Source: HVS
Both demand and occupancy steadily improved from 2004 through 2007, before declining somewhat in 2008. Meanwhile, average rate rose sharply from 2004 through 2008. The recession clenched the market later that year, resulting in occupancy and rate declines in 2009. Although Austin’s overall average rate continued to decline into 2010, the local economic recovery spurred a rebound in both demand and occupancy, and average rate resumed its upward track in 2011. Occupancy and rate continued to grow in 2012 and 2013, reaching their highest levels ever in 2014. Average rate reached its highest in 2015.
Notably, average rates in Austin fell by less than 10% during the last recession, which illustrates the resiliency of the market and its popularity among commercial, group, and leisure travelers—even during a massive economic downturn. Expanding commercial and leisure demand throughout the city reinforces the positive prospects for hotel performance, with numerous commercial developments and new attractions such as the opening of the Circuit of the Americas stadium and racetrack bringing more travelers to Austin hotels.
Rising demand for rooms in Austin has created a robust development pipeline. The new hotels are crucial to accommodate both current demand and anticipated demand growth in Austin. The U.S. Census Bureau estimates that the city’s population grows by some 110 people a day. Ongoing growth in the commercial sector, which has been concentrated in northwest Austin and the city’s urban core, includes the expansion of Apple’s campus and employment base. The associated rise in demand has given brands and developers the impetus to break ground on new hotels.
Austin Supply and Demand to Reach Equilibrium in Late 2015
Source: HVS
The November 2012 opening of the Circuit of the Americas racetrack, which hosts international F1 and Motocross events throughout the year, has enhanced Austin’s leisure draw. The circuit’s events have international appeal, and the 120,000-seat venue nears capacity for major events, producing significant demand for local hotels. The summer installment of ESPN’s XGames at the Circuit of the Americas has also increased Austin’s profile as an international host city for events. The South by Southwest (SXSW) Conference and Festival continues to grow, and the Austin City Limits Music Festival has expanded to two weekends (October 2–4 and 9–11 in 2015).
The JW Marriott opened in Downtown Austin in February 2015; the hotel features 1,012 guestrooms, making it the largest in the JW Marriott brand. The new Marriott hotel joins the existing 800-room Hilton and the upcoming 1,066-room Fairmont (currently under construction and set to open in 2018) in preparing Austin to host larger citywide conventions. This enables the city to compete for national conventions that otherwise could not be accommodated due to the limited room supply in the CBD. As a result of the two additional convention hotels, convention center officials are looking to expand the facility.
The commercial, leisure, and meeting and group demand generated by these developments should keep pace with the additional inventory. The city’s overall average rate should also continue to climb, albeit more moderately.
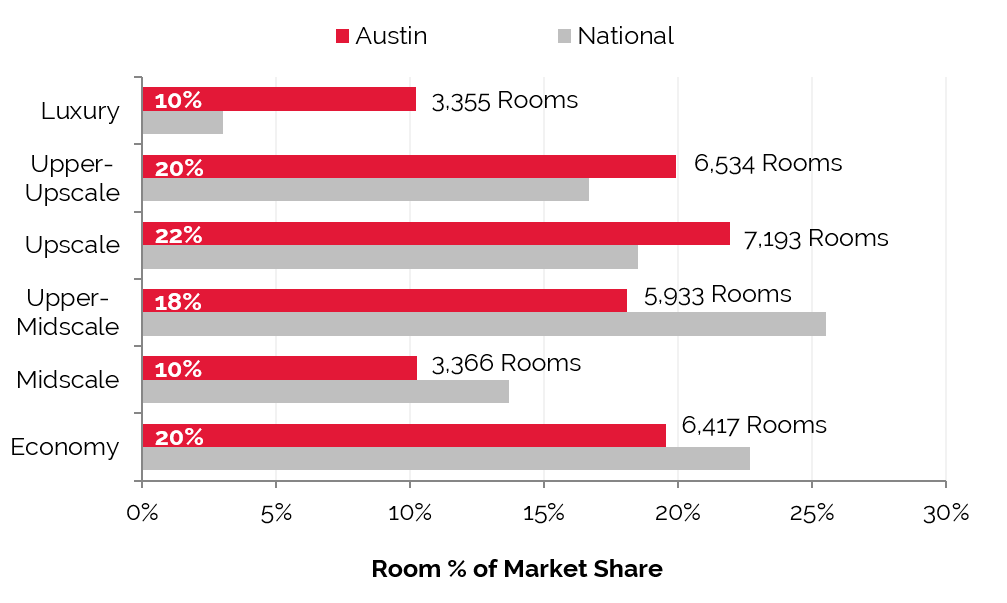
Existing Supply Breakdown
About 29% of Austin-area hotels are economy properties, and upper-upscale and upscale hotels provide the most rooms at approximately 13,727 rooms combined. Economy hotels follow with approximately 6,400 rooms. The luxury hotel product yields 3,355 rooms, or 10% of total room supply.
Economy hotels in Austin represent a curious phenomenon. Many opened years ago as higher-class hotels but have traded down as facilities aged and franchises were either changed or lost altogether. Though the economy class consists of the city’s oldest properties, they are hardly obsolete. Budget-conscious tourists, locals who need temporary accommodations and other price-sensitive lodgers tend to home in on the economy beacon. Hotels that are well maintained and up to date with brand-mandated property improvement plan (PIP) requirements are in the best position to capture demand and command higher rates.
Upper-midscale hotels are the most sought after in the market, as they generally offer a compromise of quality limited-service accommodations and modest average rates. These hotels are also clustered near the downtown area and the interstates, offering convenient access to amenities and services. The current number of upper-midscale hotels in Austin may hinder expansion in this class, as heavy competition and the limited availability of flags due to geographic restrictions act as obstacles to growth.
Although the upper-upscale and luxury properties equate to only 14% of hotels in Austin, the room inventory of these two asset classes amounts to almost 30% of the city’s total room count. This is because these types of properties are typically big-box in nature, housing large room counts, ample meeting and event space, food and beverage outlets, and other ancillary facilities such as a spa. These hotels also tend to be located close to the city’s largest demand generators, particularly the CBD and the Arboretum/Domain area. Pent-up demand among the market’s least price-sensitive travelers bodes well for the existing supply, as well as new development within the upper-upscale and luxury classes.
The charts below present a breakdown of Austin’s room inventory by hotel class.
Largest Portion of Rooms in Austin is Economy, While Upper-Midscale Class Leads the Nation
Source: STR
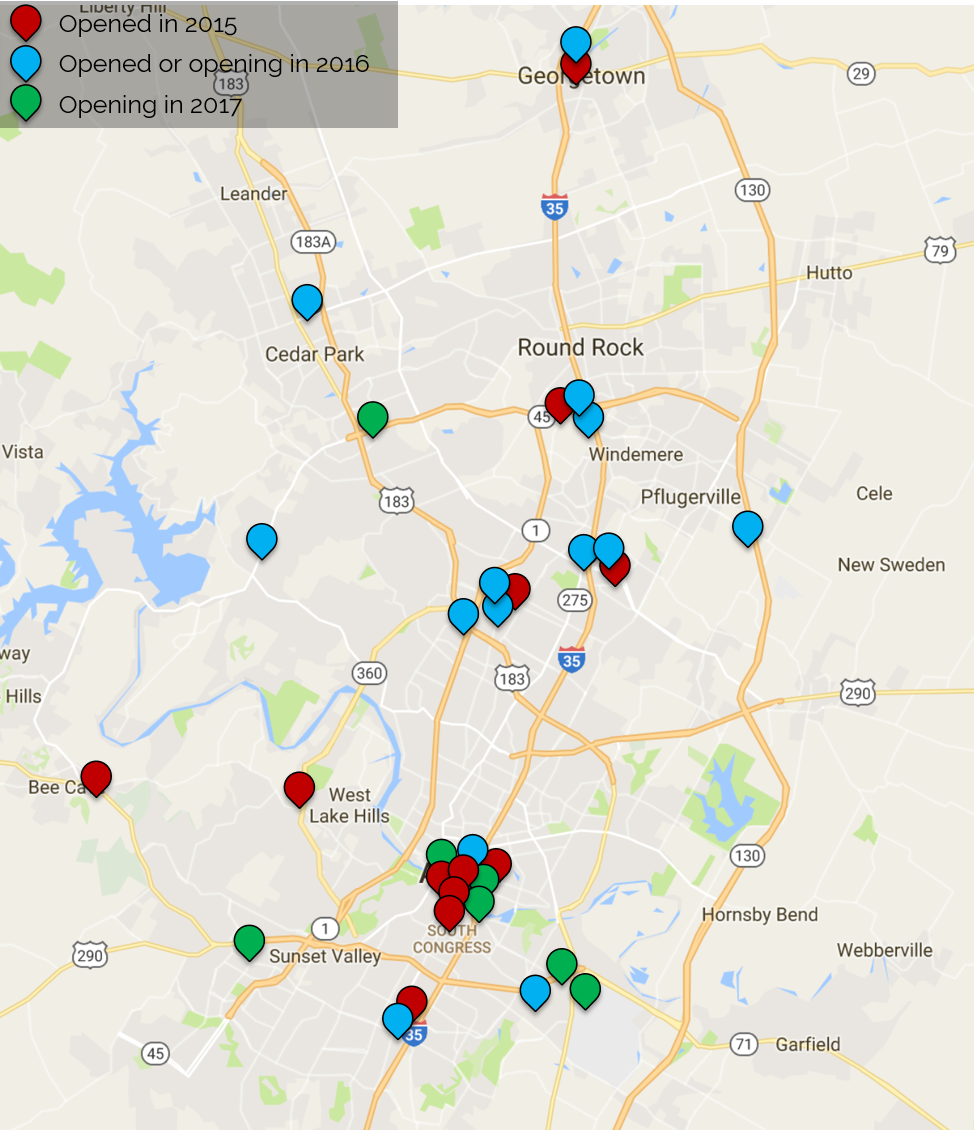
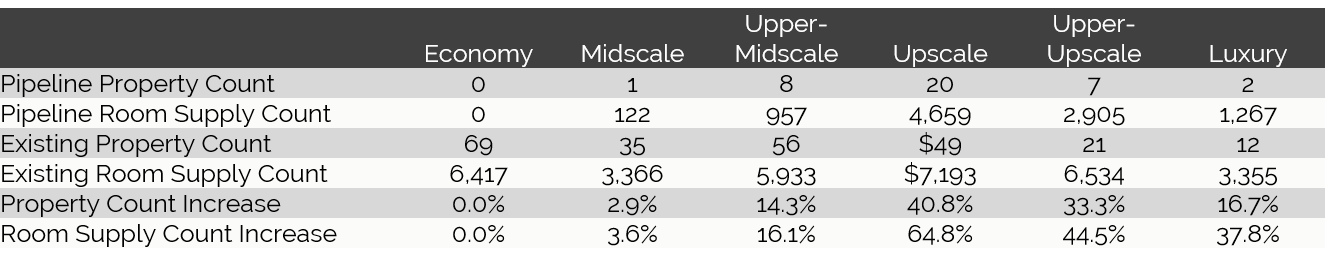
New Supply Pipeline
Hotels belonging to the upper-upscale and upscale classes dominated the new supply pipeline in 2015, while upscale new supply is expected to continue this trend through 2018. This is driven by the needs of existing and expanding commercial and leisure demand generators in Austin. This trend is especially apparent in the city’s downtown core, which tends to generate a wealth of higher-rated clientele. Developers are taking advantage of the higher rates that these hotels command given the number of travelers to Austin with the means to pay for a centrally situated, higher-class hotel of rooms.
Recently Opened Hotels and New Hotels Expected in Austin in 2016 and 2017
Source: STR
These proposed hotels reflect an increase of approximately 4,400 rooms among the active projects. Given the existing supply of 32,798 rooms in the city, the increase in numbers of rooms is anticipated to be roughly 13.5% through 2019.
While a large number of new rooms are barreling through the Austin hotel pipeline over the next several years, the composition varies widely by hotel class, which should provide for a healthy competitive landscape. The variety of product types and price points of the incoming supply should satisfy a wide variety of travelers. As previously mentioned, the new JW Marriott and the upcoming Fairmont hotel are set to catalyze greater levels of demand as they allow Austin to accommodate bigger events and conferences. The Dell Medical School has spurred development among extend-stay hotels. The mix also includes a number of boutique properties aimed to accommodate independent travelers coming to Austin to explore a plethora of leisure activities. The increase in supply should also force existing hoteliers to complete brand-mandated property improvement plans in order to remain competitive with the other properties in the market and achieve their targeted average rate and RevPAR levels. As the full complement of new supply is introduced to the market, we anticipate a move toward equilibrium of supply and demand.
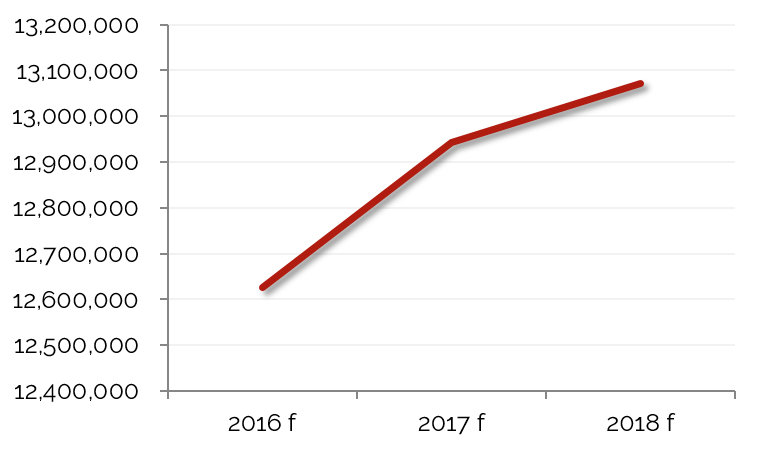
Lodging Room Supply Expected to Increase 2016–2018
Source: HVS
Austin’s Upscale Inventory set to Increase More Than 60%, while Economy Inventory Stabilizes
Source: HVS & STR
Hotel Value Trends
The annual HVS Hotel Valuation Index (HVI) compiles data derived from over 4,500 hotel appraisal assignments each year, providing for analysis of performance and forecasts for hotel markets nationwide. The Austin hotel market achieved annual RevPAR growth of roughly 10.5% from 2011 through 2013—a remarkable achievement that places Austin among the top markets for growth in the nation. Market-wide occupancy surpassed 70% in 2013, and average rate fell just shy of the $120 mark for that year. Prior to 2013, occupancy in Austin had surpassed the 70% level only once since 1997, and the city’s average daily rate for 2015 has never been higher.
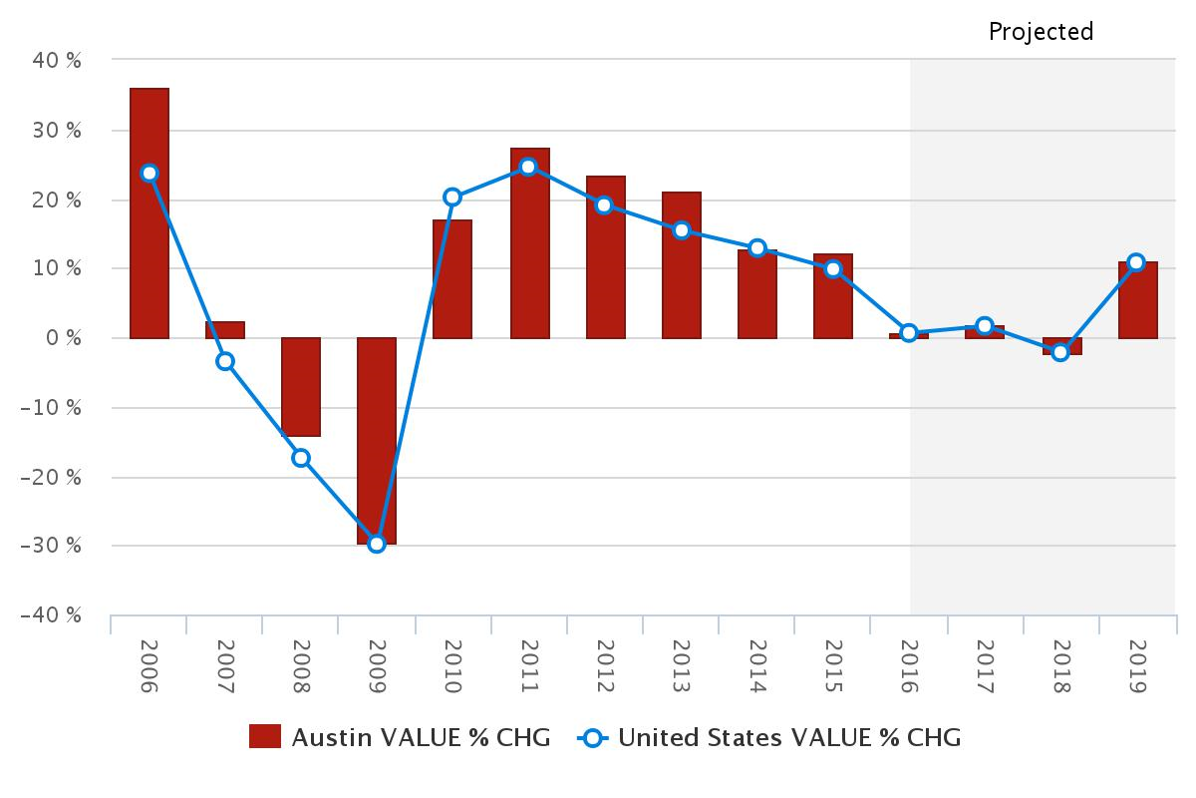
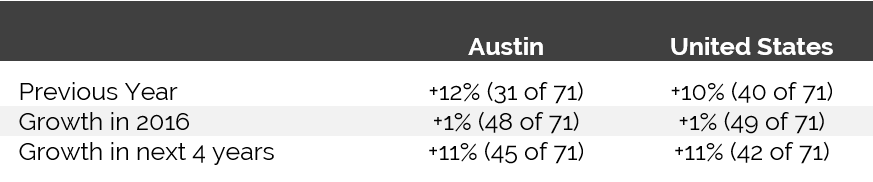
The HVI also provides insight into hotel values. In 2015, Austin ranked 31st among 71 major U.S. cities in hotel value growth; hotel values in Austin rose by 12% that year, which also outpaced the United States as a whole. Austin hotel values are anticipated to rise by another 1% in 2016, with 11% growth between 2016 and 2019.
The following chart illustrates the trajectory of hotel values in Austin from 2006 through 2019 (projected).
Hotel Values Drop Sharply in 2009, Rise Quickly Post-Recession
Source: HVS & STR
Valuation Trends and Forecast
Ratings are comparable to 65 major U.S. cities, including the nation.
Source: HVS & STR
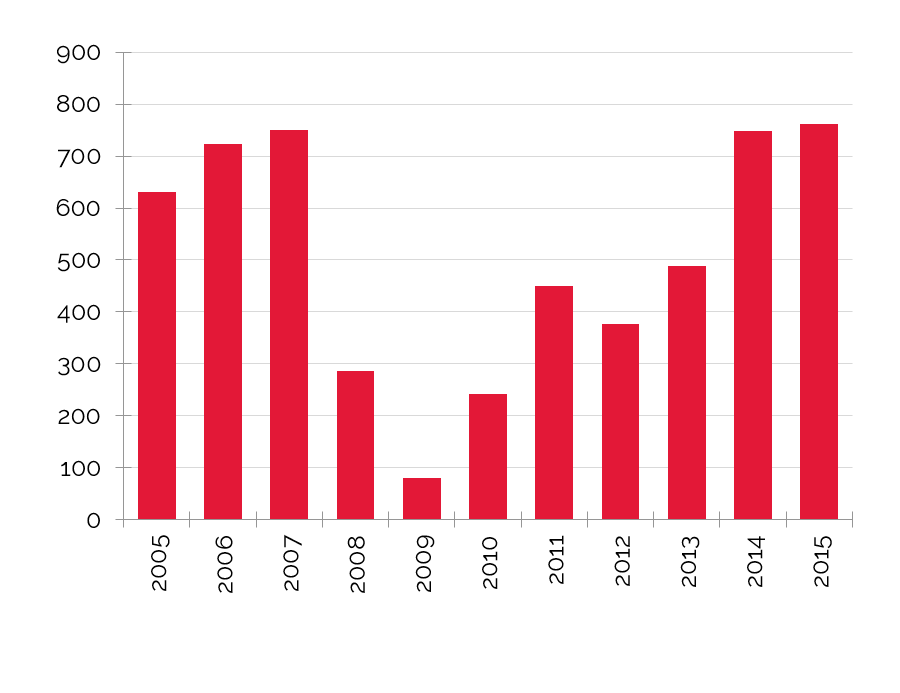
Recent Hotel Transactions
The following table details confirmed hotel transactions in Austin since 2013.
Number of Hotel Transactions Decreases in Year-to-Date 2016
Source: HVS & RCA
Transaction activity has been strong in the Austin area, with buyers competing heavily for the limited number of assets for sale, and sellers seeking to monetize their investment gains. Although sale prices have averaged just over $400,000 per room since 2013, pricing is highly dependent on historical operations, location, product type, and if the property was under financial distress.
Austin’s transactions, which total just over $1 billion in volume, include such high-profile assets as the Omni Barton Creek Resort and Spa, whose estimated price of $200 million was the highest paid in the Austin MSA; the Four Seasons, which held the highest total price paid for a non-resort property; and the Driskill Hotel, which had the highest price per key among independent, non-resort properties at $450,000.
Interest among investors remains high and continues to put downward pressure on capitalization rates, particularly in high barrier-to-entry submarkets such as the CBD and the Domain/Arboretum. The high level of investor interest, Austin’s thriving economy, and growing demand generated by the high-tech sector support a positive outlook for the city’s hotel industry overall, with values set to rise through 2017.Across the nation, according to Real Capital Analytics (RCA), the lowest-priced confirmed hotel sale for the preceding three years was the Hotel Seagate in the Toledo, Ohio CBD at $2,830 per key. The next two lowest sales occurred in Chicago and Atlanta. The highest-priced confirmed sale, at $1.85 million per key, was the purchase of the Park Hyatt Hotel in the Manhattan Midtown West neighborhood. The next runner up was the Hollywood St. Louis in Missouri at $1.22 million.
Number of Major U.S. Sales
($10M and above)
Average U.S. Key Price per Room
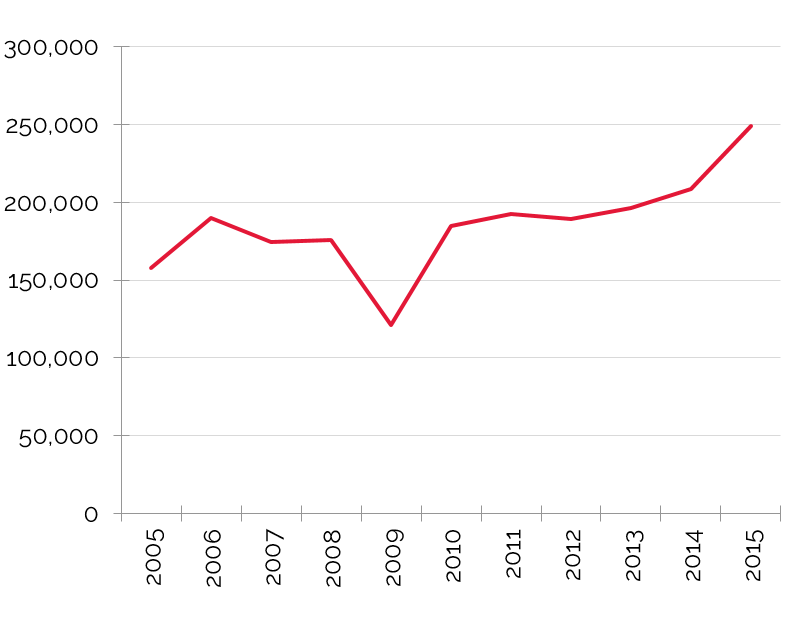
Source: RCA
Key Economic Indicators
Economic and Demographic Review
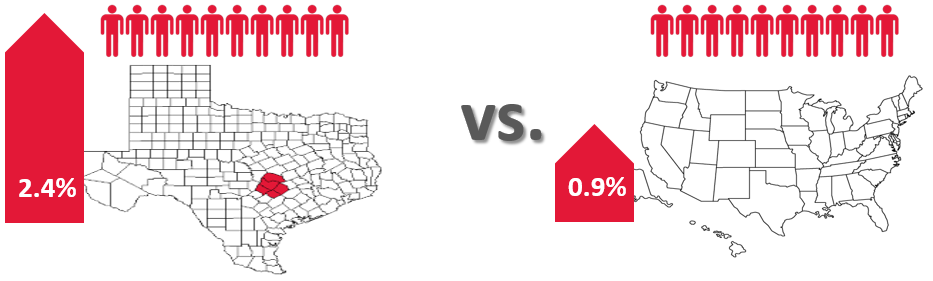
The U.S. population has grown at an average annual compounded rate of 0.9% from 2010 through 2015, and that rate is forecast to increase to 1.0% into 2020. Travis County’s population outpaced the nation in the decade leading up to 2010 with a growth rate of 2.3%, but since 2010 that rate has slowed and leveled off at 2.0%, where it is anticipated to decreased to 1.7% through 2020. Even at that rate, however, Austin continues to eclipse the national average, with the population growth spurred by new employment opportunities in the city.
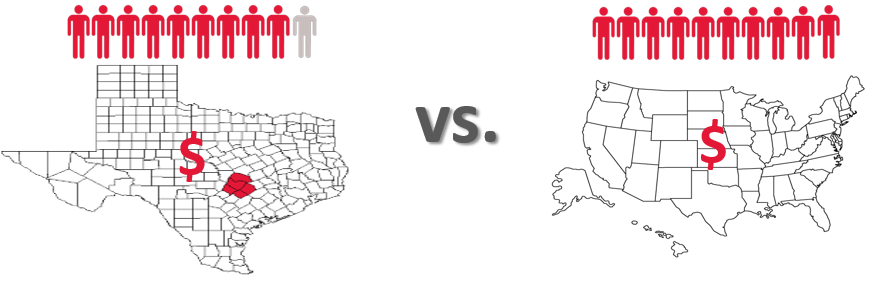
The average annual compounded growth rate of per capita personal income for the national between 2010 and 2015 outpaced the county’s average by 24%. Travis County is projected to exceed the national rate by 20% into 2020, with the county at a growth rate of 1.6% and the nation’s at 1.3%
Austin's MSA average annual compounded growth rate of resident population has been 2.5 times higher than that of the nation.
Average annual compounded growth rate of per-capita personal income for the MSA was 11% higher than that of the nation in the 2010-2015 period.
"Austin MSA" by Acntx at the English language Wikipedia. Licensed under CC BY-SA 3.0 via Commons - https://commons.wikimedia.org/wiki/File:Austin_MSA.png#/media/File:Austin_MSA.png
The national wealth index for the nation trended flat from 2000 to 2015; it is anticipated to remain flat into 2020. Travis County’s wealth index climbed steadily from the -0.9% rate registered during the 2000 to 2010 period to 0.0% from 2010 to 2015; the county’s wealth index is expected to grow by 0.1% into 2020.
Food and beverage sales in the county totaled $2.631 billion in 2015, versus $2.238 billion in 2010. This reflects a 3.3% average compounded annual change. Through 2020, the pace of growth is expected to moderate slightly to 2.5% for the county, again exceeding the anticipated national growth rate of 1.9%.
The retail sales sector for the county totaled $15.934 billion in 2010 and grew to $18.992 billion in 2015; retail sales are predicted to reach $21.576 billion in 2020, a compounded annual growth rate of 2.6%. This is 31% stronger than the forecasted U.S. annual compounded growth rate of 2.0%.
Radial Demographic Indicators
The following table reflects radial demographic trends for the Austin market area measured by three points of distance from the center of Downtown.
Demographics by Radius from the Center of Town
Population Growth to Decline within
Five-Mile Radius 2015–2020
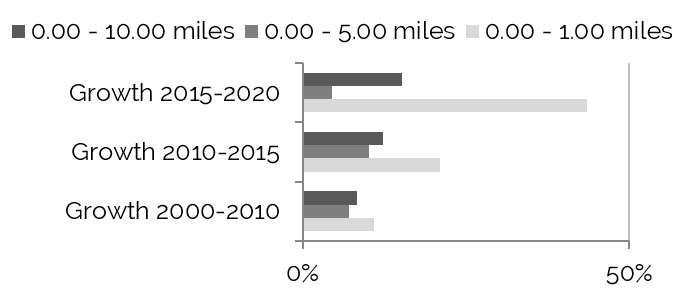
Source: The Nielsen Company
Household Growth Most Stable within
One-Mile Radius 2015–2020
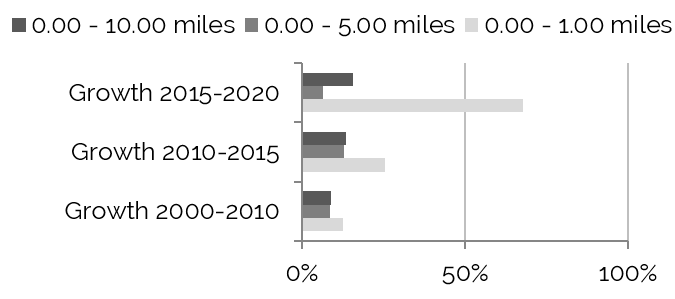
Source: The Nielsen Company
Top Five Occupations – Estimated for 2015
Within One-Mile Radius

Within Five-Mile Radius

Within Ten-Mile Radius

Source: The Nielsen Company
Population growth within one mile of the center of downtown was a significant 43.6% from 2000 to 2010, whereas the greater area experienced a less pronounced yet still healthy growth rate of 15.2% during this same period. Although the overall growth rate slowed to 21.0% from 2010 to 2016, projected growth is anticipated to continue at about 10.9% per year into 2021. Households are expected to grow at a rate of 12.5% per year into 2021.
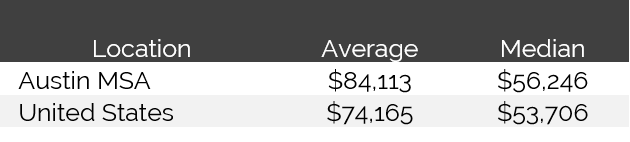
Austin’s forecasted 2016 average and median household incomes, skewed low due to the large number of University of Texas students, are strong in comparison to other Texas cities, as well as the nation.
2016 Forecast – Average and Median Household Income
Source: The Nielsen Company
Workforce Characteristics
The characteristics of an area’s workforce provide an indication of the type and amount of transient visitation likely to be generated by local businesses. Sectors such as finance, insurance, and real estate [FIRE]; wholesale trade; and services produce a considerable number of visitors who are not particularly rate-sensitive. The government sector often generates transient room nights, but per-diem reimbursement allowances often limit the accommodations selection to budget and mid-priced lodging facilities. Contributions from manufacturing, construction, transportation, communications, and public utilities [TCPU] employers can also be important, depending on the company type.
From 2000 to 2010, total employment in the county grew at an average annual rate of 2.4%. This rate was below the growth rate recorded by the MSA, but outpaced the national average. The pace of employment growth in the county remained the same on an annual average from 2010 to 2015. Woods & Poole Economics, Inc. anticipates total employment in the county to change by 2.3% on average annually through 2020. The county trend is 70% more robust than the forecasted rate of change of 1.3% for the U.S. as a whole.
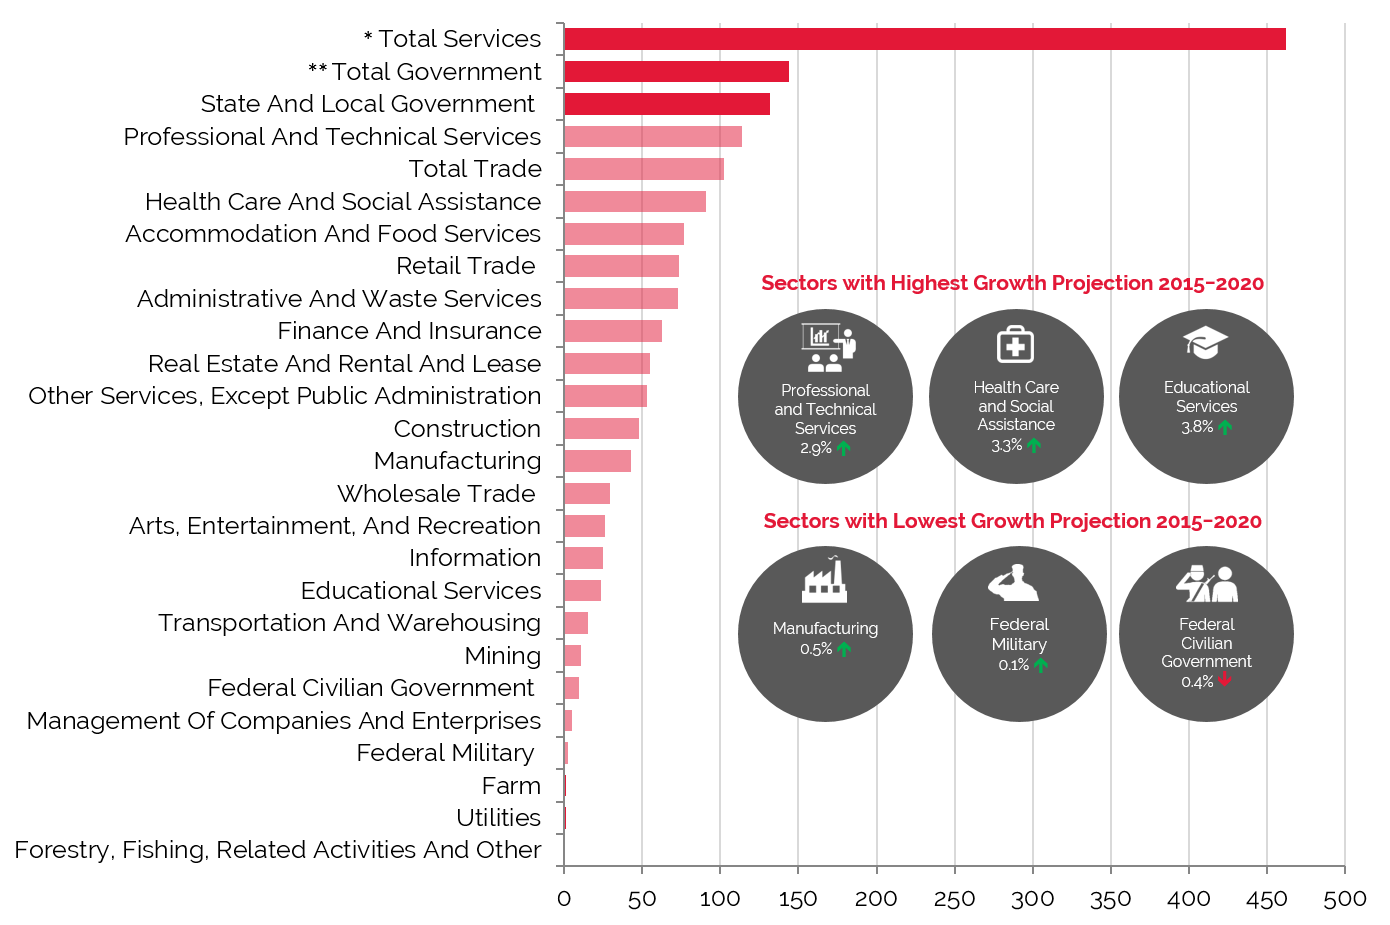
The finance, insurance, and real estate [FIRE]; wholesale trade; and services employment sectors represented 44.3% of total employment in Travis County in 2015, with an average annual compounded growth rate expected to be approximately 13.6% into 2020; as stated above, these sectors are important drivers of demand to higher-rated hotels. Total Government, the second-largest primary employment sector in 2015, tends to generate demand for economy properties, as per-diem rates limit travelers to lower-priced hotels.
The largest primary sector was Total Services, which recorded the highest rise (86,610) in number of employees during the period from 2010 to 2015. Of the various sub-sectors included in Total Services, Health Care and Social Assistance and Accommodation and Food Services were the largest employers.
Employment Projections through 2020 Show Impressive Growth in Total Services, Total Government and Total Trade
Source: Woods & Poole Economics, Inc.
* Total Services include: Professional and Technical Services; Management of Companies and Enterprises; Administrative and Waste Services; Educational Services; Healthcare and Social Assistance; Arts, Entertainment, and Recreation; Accommodation and Food Services; and Other Services, except Public Administration
** Total Trade includes Wholesale Trade and Retail Trade
Employment
Austin's collection of businesses, government agencies, entertainment venues, historical attractions, and The University of Texas serve as a platform for the city’s diverse workforce. Government jobs and investments related to state, city, county, and federal entities provide a solid economic base for the area. In addition, The University of Texas has continually supplied the local labor pool with young, well-educated, and relatively inexpensive workers. In 2016, Austin regains the first place on Forbes annual list of America’s fasted growing cities. By 2014, Austin ranked first for the fourth consecutive year.
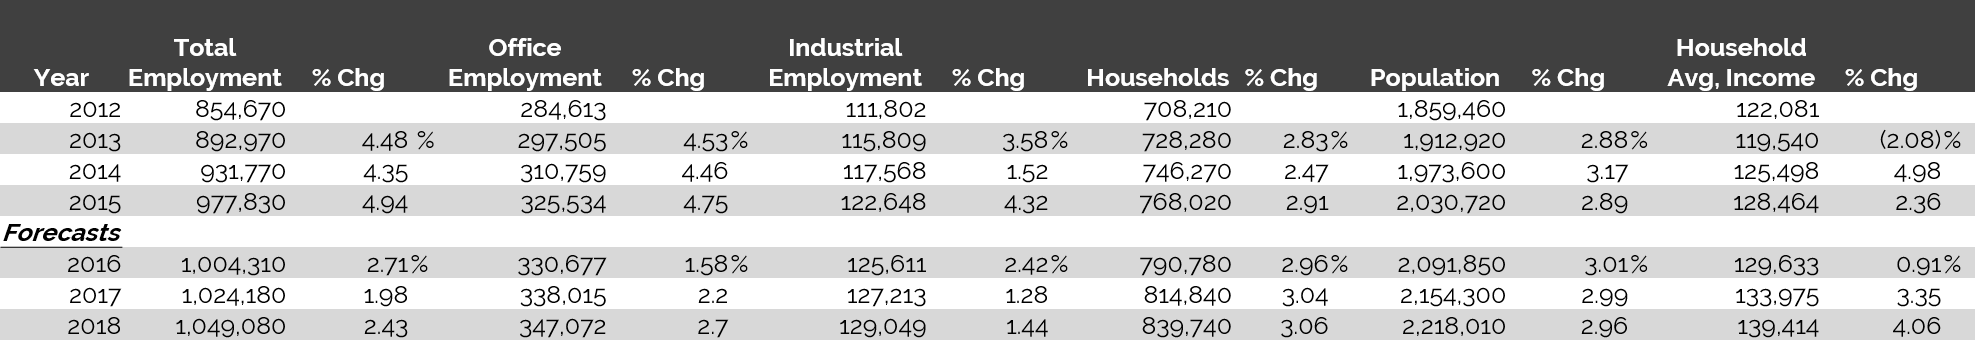
The following table illustrates historical and projected employment, population, and income data for the overall Austin market.
Historical Employment, Households, Population, and Household Income Statistics
Source: REIS Report, 2nd Quarter, 2016
Top Industries In Austin
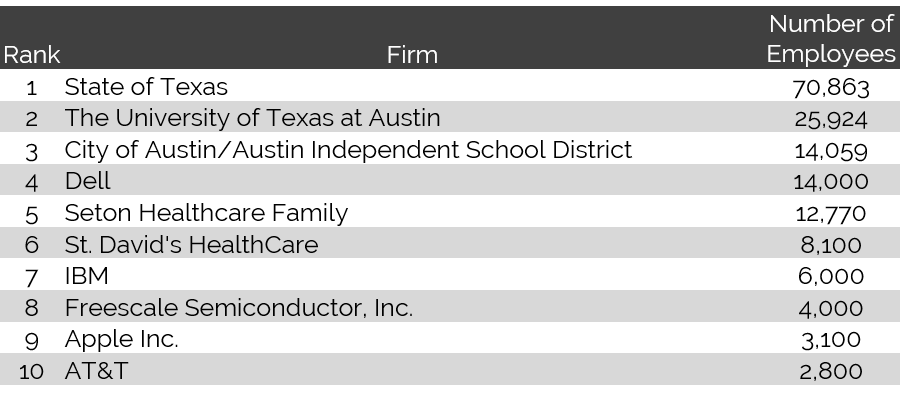
Technology and multimedia platforms have grown into primary industries in Austin. Dell Computer Corporation, Austin’s largest private employer, maintains its world headquarters in Round Rock, approximately 18 miles north of Austin's Central Business District. Freescale, IBM, Computer Sciences Corporation, Applied Materials, Samsung, and Google also have a strong presence in Austin. Facebook, LegalZoom, HostGator, SunPower, and Cirrus Logic have opened regional headquarter offices in Austin; Altera Corporation and Electronic Arts completed expansion projects in 2012; and eBay is conducting facility and employment expansion programs that will continue through 2021. Union Pacific, the nation's largest railroad operator, opened a software development center at Las Cimas Parkway and Capital of Texas Highway/State Highway 360 in December 2012. Additionally, Apple is constructing a one-million-square-foot operations center that will reportedly create 3,600 new jobs over the next six years.
The University of Texas (UT) at Austin, the state’s flagship university, enrolls over 50,000 students and features 18 colleges and schools, 17 libraries, 7 museums, a Presidential Library, and a $2.1-billion operating budget. U.S. News & World Report ranked 37 of the university's graduate programs, including Law, Business, Engineering, and Education, within its top ten lists for 2015. Ground was broken for the Dell Medical School at UT in April 2014. Phase I of the project includes the construction of a research building, a medical office, a parking garage, and an education administration building.
Top 10 Employers in Austin by Number of Employees
Source: Austin Business Journal, 2015
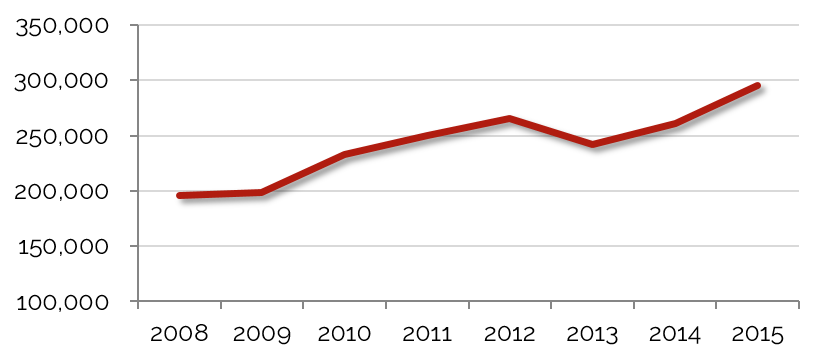
Furthermore, the new medical school should open construction of Seton Medical Center at UT, the primary training site for students at the new Dell Medical School, began in August 2014. The $295-million, 211-bed hospital is scheduled to open in 2017.
Government jobs and investments related to state, city, county, and federal entities provide a solid economic base for the Austin area. The city's substantial federal presence includes the United States Internal Revenue Service (IRS), which employs roughly 4,500 locally. During each month of its 140-day biennial sessions, typically attracting approximately 180 legislators to Austin, the Texas Legislature produces an estimated $30-million impact on the local economy.
Unemployment
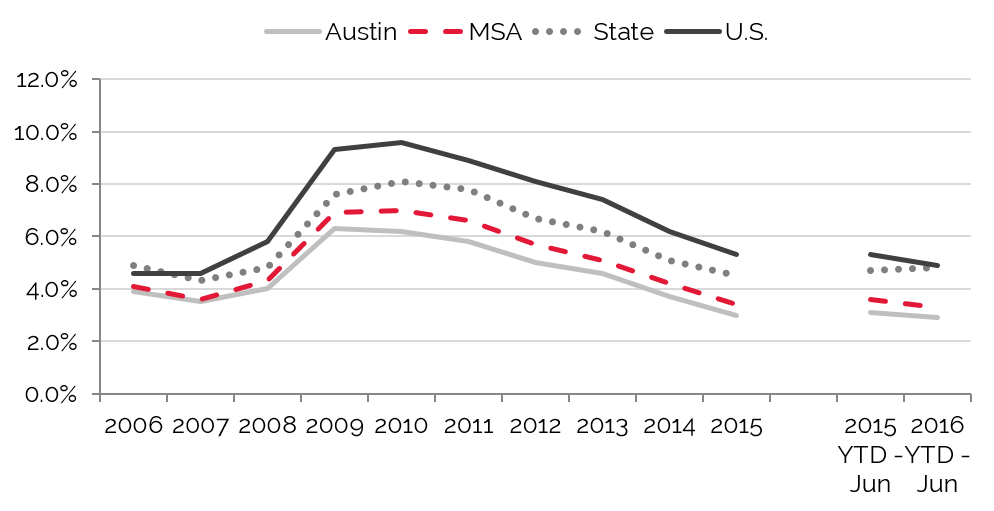
The adjacent chart illustrates historical unemployment levels for the city of Austin, the Austin-Round Rock MSA, the state of Texas, and the United States.
Current Unemployment Rate Rivals Pre-2008 Rates
Source: U. S. Bureau of Labor Statistics
After rising for two years, unemployment in Austin peaked in 2010, a situation similar to that of many cities as the nation reeled from the recession; nevertheless, local unemployment was considerably lower than state and national levels during that time. Unemployment began to fall in 2011, and this trend continued through 2015. Local employment remains stable within the government and education sectors, and high-tech job growth has continued since 2011; moreover, Apple's new campus is expected to bring 3,600 new jobs to the city by 2021. According to economic development officials, local employment is projected to continue to climb as area businesses increase spending in line with the strong economic growth in Austin.
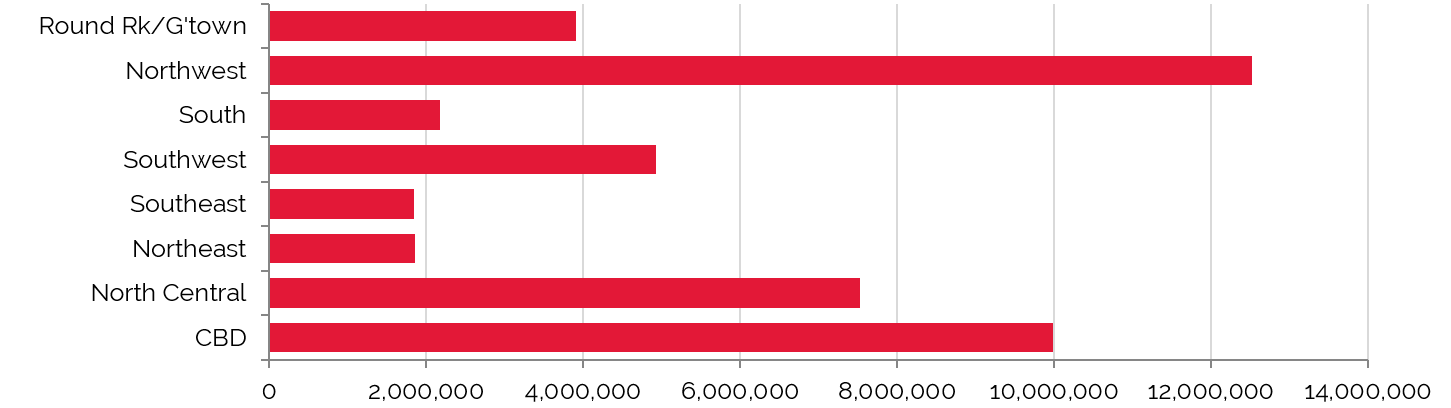
Office Space
Trends in occupied office space are typically among the most reliable indicators of lodging demand, as firms that occupy office space often exhibit a strong propensity to attract commercial visitors. Thus, trends that cause changes in vacancy rates or in the amount of occupied office space may have a proportional impact on commercial lodging demand and a less direct effect on meeting demand. The adjacent table details office space statistics in Austin.
Greater Austin’s 38 million square feet of office space had an overall vacancy rate of 13.0% and an average asking rent of $23.25 for the second quarter of 2016. Austin’s abundance of Class A office space has made the city one of the most desirable in the south-central U.S.; revitalization efforts throughout the CBD and other areas such as The Domain, located in the Northwest submarket, have also helped make the city attractive to office tenants. With the second-most rentable square feet among all of Austin's submarkets, a low vacancy rate, and the highest rental rates, the CBD office market has proven to be a major hub for much of the city's growth and demand. High demand, in fact, has made it very difficult to obtain Class A space within the CBD submarket, thus driving additional office development projects.
The Northwest submarket, considered the hub for the high-tech industry in Austin, is characterized by a strong office inventory, a low vacancy rate, and high leasing rates. Austin has also become a prime choice for financial conglomerates, the entertainment industry, and large law firms. These tenants continue to add jobs and absorb new office space. This activity should, in turn, lead to greater demand for lodging throughout the area. We note that these office statistics do not include owner-occupied buildings; the CBD is replete with city, county, state, and federal offices that are all fully occupied.
Northwest Submarket Outperforms Overall Market
Source: REIS Report, 2nd Quarter, 2016
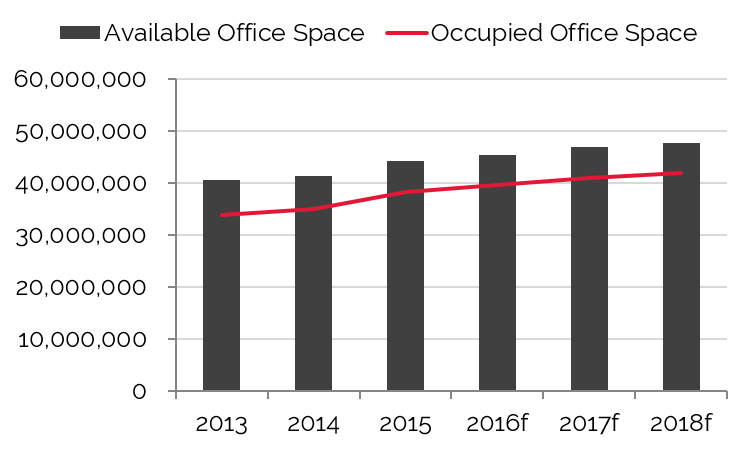
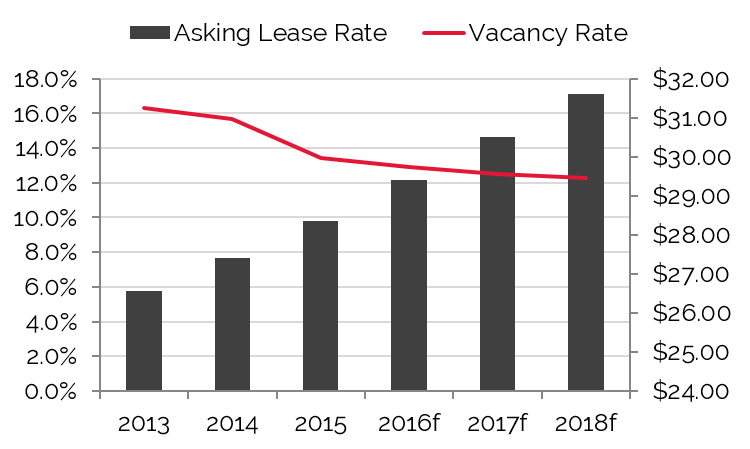
The inventory of office space in the Austin market increased at an average annual compound rate of 2.6% from 2003 through 2015, while occupied office space grew at an average annual rate of 1.5% over the same period. The market’s strength is evident in the 2.1% average annual change in occupied office space from 2010 to 2015. From 2016 to 2020, the inventory of occupied office space is forecast to increase at an average annual compound rate of 2.1%, with available office space expected to increase 2.7%; this would result in an anticipated vacancy rate of 11.0% as of 2020, the lowest level in a decade.
Southeast Region has Lowest Vacancy Rates
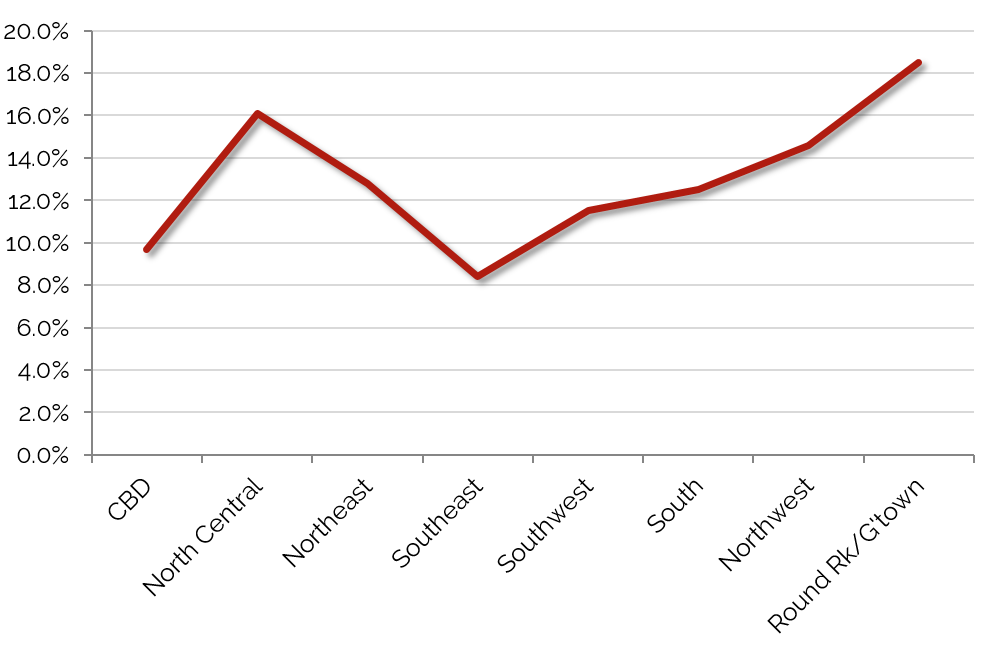
CBD Boasts Highest Asking Lease Rates
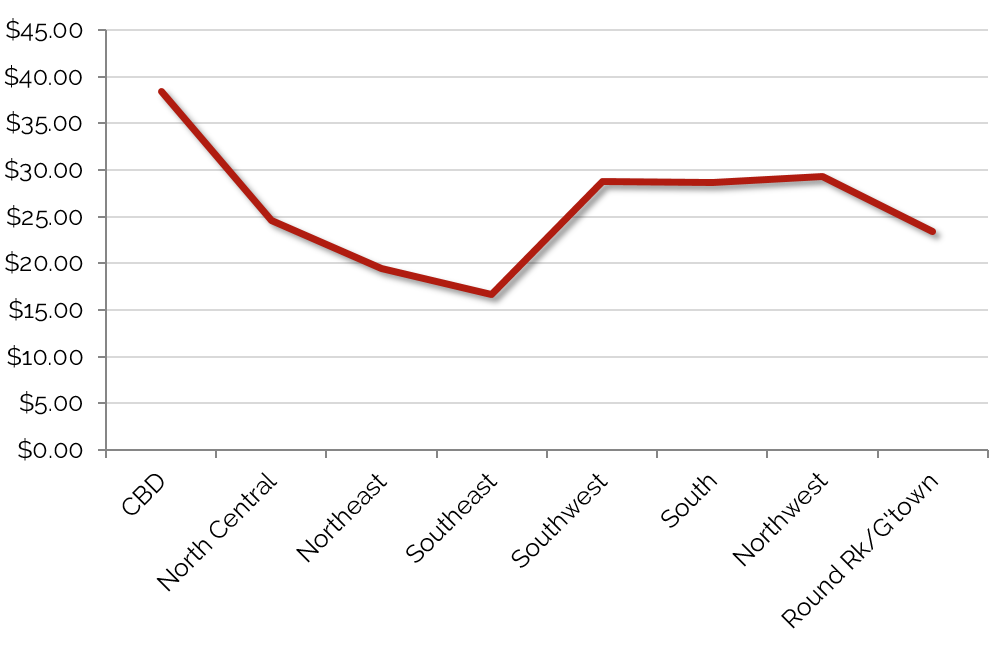
Source: REIS Reports, 2nd Quarter, 2016
Both Available and Occupied Office Space to Experience Steady Growth
Vacancy Rate set to Drop in 2015, More Sharply in 2016
Source: REIS Reports, 2nd Quarter, 2016
Convention Activity
A city’s convention activity helps gauge meeting and group visitation and demand for nearby hotels. Typically, hotels within three miles of a convention center benefit the most from this demand, and headquarter hotels can command premium rates. Very large conventions also drive demand to peripheral hotels, which can benefit from compression within the city as a whole.
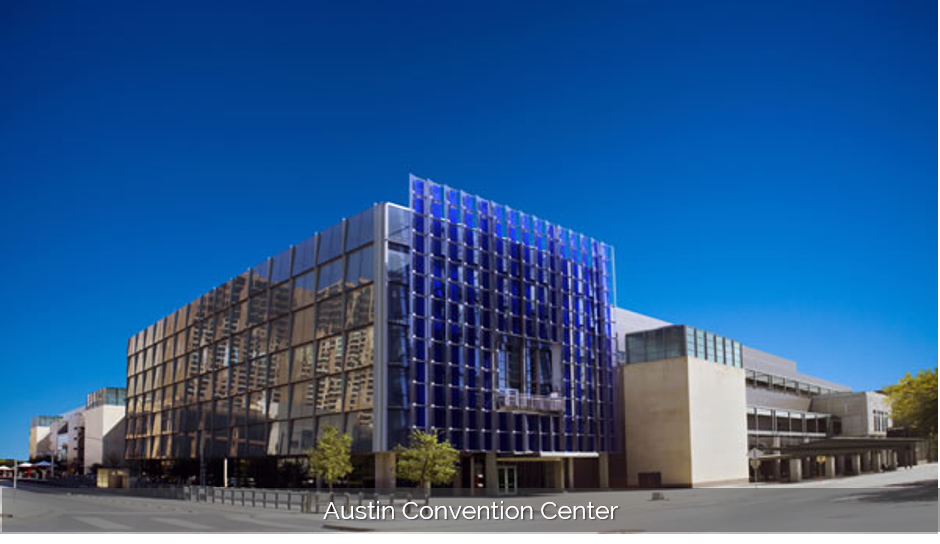
The Austin Convention Center (ACC) underwent a $110-million expansion in 2002 that brought the size of the facility to roughly 881,400 gross square feet, encompassing six city blocks. The ACC currently features roughly 246,097 square feet of contiguous and column-free exhibition space within five exhibit halls; the center’s Grand Ballroom measures approximately 43,300 square feet. The ACC's telecommunications infrastructure enables the facility to support gigabit Ethernet over its fiber-optic network, making exhibitions and trade shows a more "hands-on" experience for both attendees and exhibitors.
The facility, in conjunction with the 800-room Austin Hilton Hotel and the 1,012-room JW Marriott opened in 2015, provides a highly competitive and attractive convention package for the market.
Room-Night Demand for Convention Peaked in 2015
Source: Austin Convention and Visitors Bureau
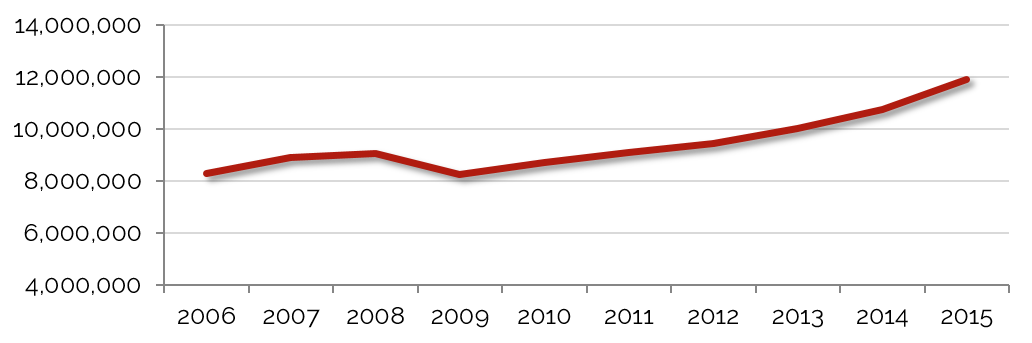
Airport Traffic
Airport passenger counts are important indicators of lodging demand. Trends showing changes in passenger counts also reflect local business activity and the overall economic health of the area. Apart from commercial flights, Austin-Bergstrom International Airport (AUS) serves the State Aircraft Pooling Board and the Texas Army National Guard.
The $62-million Terminal East Infill project, which began in 2013, will expand the terminal by 55,000 square feet and renovate 17,000 square feet of existing airport space; this and a parking garage expansion project was completed in 2015. Future development plans call for the addition of six or seven gates to the east side of the terminal.
Airport Passenger Traffic Peaks in 2015
Source: Austin-Bergstrom International Airport
The airport’s growth in passenger traffic well outpaces the national average, and major air carriers have responded to the booking demand with additional service through Austin. In 2013, Southwest added more flights, and Virgin America began service to/from San Francisco. Since March 2014, Delta has added direct flights to/from LAX, and British Airways has added flights to/from London.
In the past decade, annual passenger traffic through Austin-Bergstrom International Airport has grown from 7.684 million to 10.719 million travelers, resulting in a 3.8% average annual compounded change. There were roughly 384,000 more passengers in May 2016 versus May 2015, an almost 8.5% increase. Growing passenger traffic means higher visitation, and these figures speak indirectly to the strength of Austin’s commercial, convention, government, and leisure sectors.
Tourist Attractions
Tourism in Austin peaks in the spring and fall, coinciding with festivals such as South by Southwest and events associated with The University of Texas. Austin’s chief attractions range from historic buildings to state-of-the-art sports facilities.
The Texas Capitol was placed on the National Register of Historic Places in 1970 and designated a National Historic Landmark in 1986 for its "significant contribution to American history." Guided tours of the Capitol building are offered on all days except New Year’s Day, Christmas Day, Easter, and Thanksgiving.
The University of Texas at Austin draws thousands of tourists annually to athletic competitions, performing arts events, graduation ceremonies, and special functions. Located on campus, the Lyndon Baines Johnson (LBJ) Presidential Library and Museum is the nation's most-visited presidential library.
South by Southwest (SXSW) is one of the nation’s largest music, film, and interactive festivals, with over 85,000 registrants and artists attended in 2015. Moreover, the Austin Film Festival and the Austin City Limits (ACL) Music Festival have a substantial impact on Austin’s economy, notably during the fall. The ACL Music Festival annually attracts over 65,000 visitors.
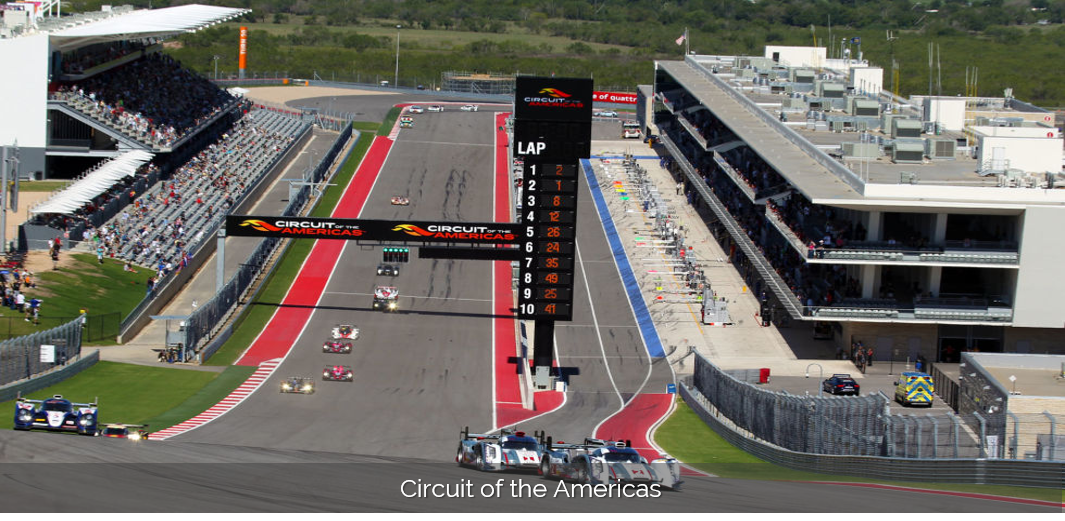 The Circuit of the Americas (COTA)
 is the first multipurpose Grand Prix racing facility in North America. With a seating capacity of over 120,000, COTA opened by hosting the American leg of the Formula 1 World Championships in the fall of 2012. Other major racing events scheduled at COTA include the Grand-Am of the Americas, the MotoGP World Championship, the ESPN X Games, and the V8 Supercars race. In addition to racing facilities, the complex contains a 40,000-square-foot conference center, retail space, and numerous restaurants.
Closing Remarks
More than ever, growth is evident in Austin. High-tech entities continue to cascade over the city’s “Silicon Hills,” and new residents arrive by the hundreds each week. Austin-Bergstrom International Airport, currently under expansion, has realized growing passenger counts year after year. Construction in the Central Business District includes office buildings, residential towers, and hotels, and The University of Texas’s new Dell Medical School started session in the fall of 2016. Add to this the expanding sports and festival crowds at SXSW, Austin City Limits, and the Circuit of the Americas speedway, which together bring hundreds of thousands of visitors to Austin each year.
While hotel development could cut into Austin’s strong occupancy gains in the near term, all signs point to further swells in demand; in fact, the promising hues on Austin’s hospitality horizon have attracted developers with confidence that growing demand will absorb the new supply. In the meantime, the city’s economic anchors continue to support residents, visitors, businesses, and hotels. It will be essential for hoteliers, investors, and developers to make informed decisions, including choosing the right project and submarket, relative to their hotel ambitions going forward in order to reap the most benefits from demand generated by Austin’s growth. Still, the overall prospects for the market’s economy and hotel industry remain positive in 2016 and beyond.