

Introduction
Following the introduction of Revenue Management (RM) in the airline industry in order to maximise the yield per available seat, made possible by the industry’s deregulation in the 1970s, RM eventually spread to the hospitality industry. Shortly afterwards, RevPAR (Rooms Revenue per Available Room) became the metric of choice for hotel asset managers, operators, investors, funders and analysts to gauge the success or lack thereof of a hotel’s room inventory management. RevPAR remains one of the most recognised and used performance measures in the hospitality industry, providing general market comparison trends and some useful revenue indications.
In the early 2000s, however, HVS London’s Russell Kett, among others, recognised the major pitfalls of looking at just RevPAR and suggested the need to use the complementary performance measure GOPPAR (Gross Operating Profit per Available Room).
This article introduces further key performance indicators (KPIs) that are considered vital in understanding a hotel asset’s performance, not just on a revenue and profitability basis in relation to the hotel’s room inventory, but also to consider how efficiently and effectively space is utilised within the entire hotel operation or in selected parts. This will enable a hotel to be assessed on a similar basis as other classes of real estate and not solely by those with a more detailed understanding of the hotel sector.
Revenue Management KPIs
KPIs refer to a set of ratios that help compare the performance and progress of a business in relation to its strategic plans or intentions. Performance indicators play a critical role in evaluating past performance and planning future decisions. Measuring business performance is the first step in the improvement process, but without knowledge and understanding of the entire operation there can be no purposeful action.
RevPAR
RevPAR, along with Average Daily Rate (ADR) and Rooms Occupancy (%), is one of the three main KPIs used to measure a hotel’s performance and success in managing its room inventory. It is calculated by dividing a hotel’s net room revenue (after discount and sales taxes and net of breakfast or other meals) by the total number of available rooms or by multiplying a hotel’s ADR by its rooms occupancy.
Table 1: Calculation of Rooms Occupancy, ADR & RevPAR
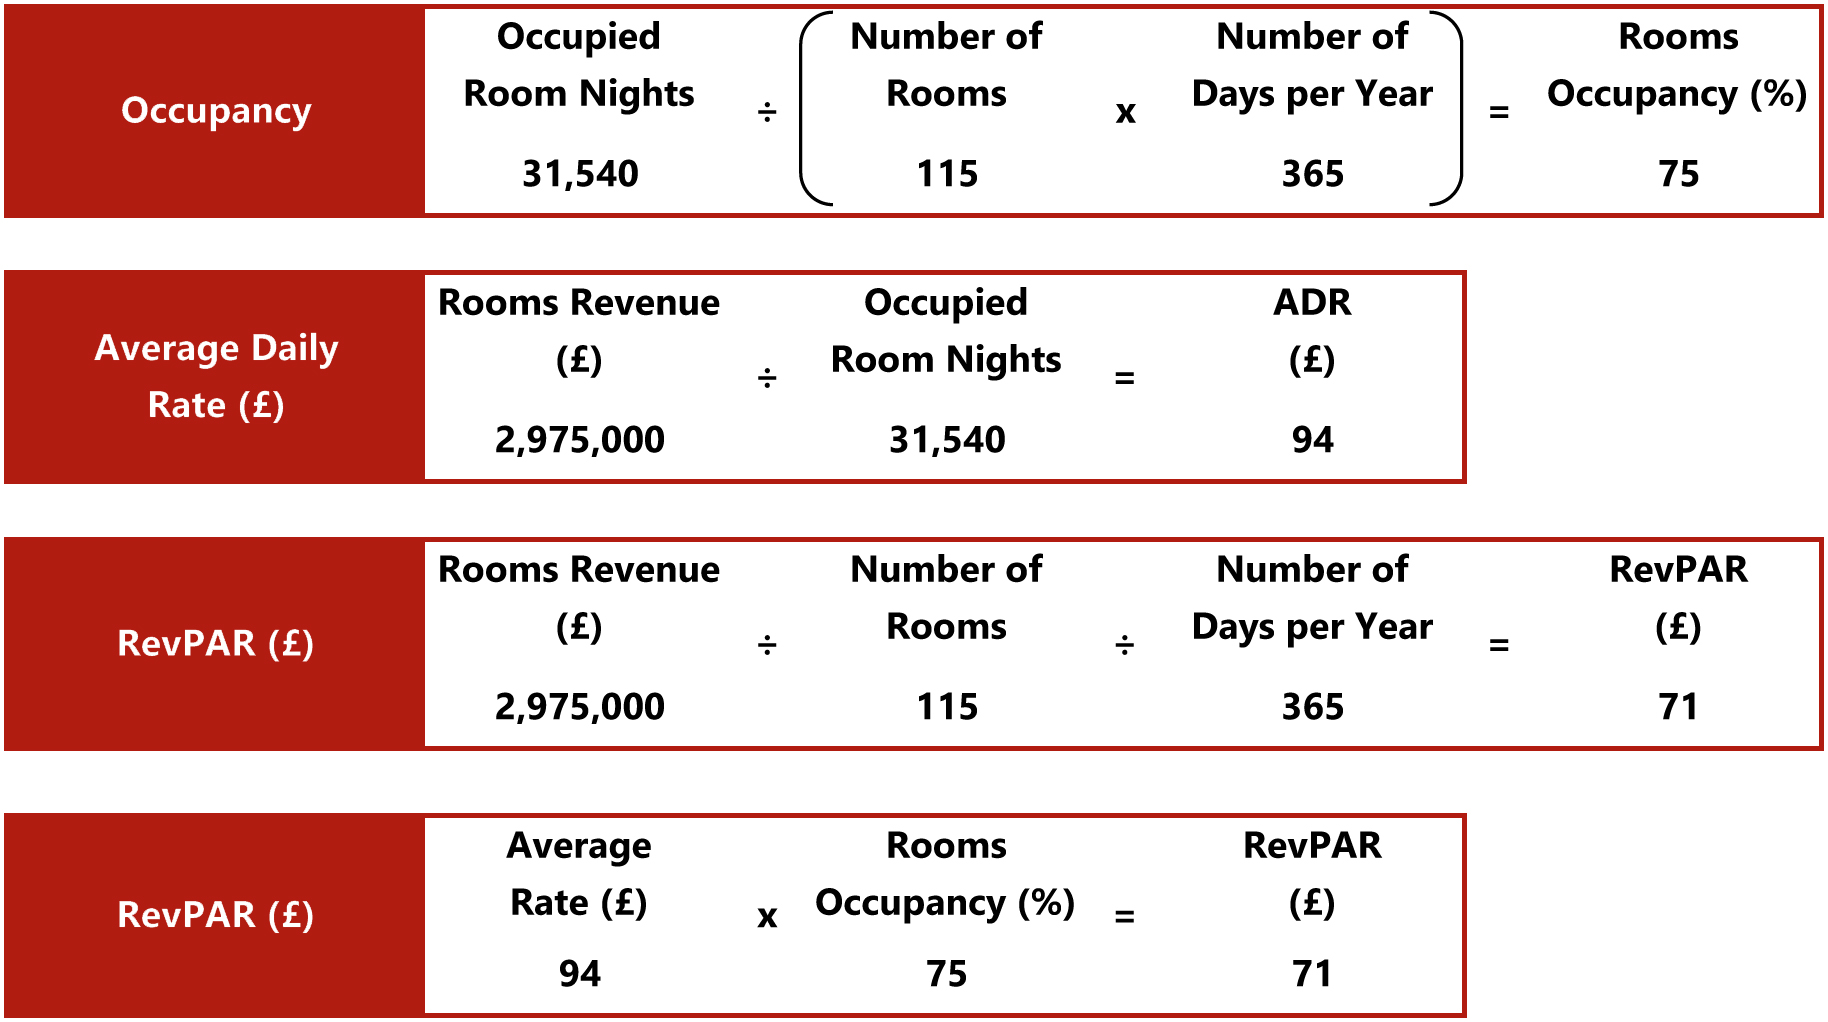
Source: HVS Research
Pitfalls of RevPAR
There are, however, several pitfalls to relying solely on RevPAR as an indicator of a hotel’s complete financial performance. The main issue is that this metric does not consider that, for hotels with substantial non-rooms operating departments (particularly food and beverage and conference operations), rooms revenue may only account for perhaps half of the hotel’s total revenue. These include hotels with substantial food and beverage (and meeting and conference) operations and other non-rooms operating departments. In such cases, RevPAR would only reflect a portion of a hotel’s revenue performance, disregarding all other sources of revenues. This will result in an inaccurate analysis when comparing hotel performances not only on a revenue basis, but also in terms of profitability, as different departments also yield a different contribution to profitability. A higher RevPAR does not always indicate an overall healthier financial performance.
A further pitfall of measuring solely RevPAR is that this metric tends to penalise a larger hotel. In equal market conditions, a 100-room hotel should achieve higher occupancy levels than a 200-room hotel, especially when there are seasonal peaks and troughs (or even fluctuation between weekday and weekend occupancy levels). As a result, RevPAR of the larger hotel is likely to be lower than that of the smaller hotel. Therefore, hoteliers and potential investors need to consider size and profitability when comparing the performance of a specific hotel in relation to other hotel properties. In many cases, owing to economies of scale and incremental revenues, a larger hotel may well have a healthier financial performance than a smaller hotel with a higher RevPAR.
Additionally, and perhaps most importantly, hotel values are typically based on net free cash flows rather than total revenues. While RevPAR is somewhat related to a hotel’s value, it is not necessarily adequately correlated to the income capitalisation value of a hotel property. However, it can be said that changes in hotel values are often highly correlated to changes in RevPAR (reflecting an elastic relationship).1
TRevPAR and GOPPAR
Once RevPAR had been taken up as the primary KPI in the industry, the understanding that other revenue sources needed to be taken into consideration for a fair comparison amongst hotels led to the recognition of TRevPAR (Total Revenue per Available Room). This KPI incorporates net revenues from all operating activities, thereby giving a better indication of how the entire hotel is performing. While RevPAR and TRevPAR may be very close for limited-service properties, the difference between the two can be significant for full-service hotels, resorts, convention hotels and so forth. However, although TRevPAR includes revenues from all revenue streams, it still does not account for the differing contribution margins.
GOPPAR is defined as total Gross Operating Profit Per Available Room, where Gross Operating Profit (GOP) is equal to total revenue less the total departmental and undistributed departmental operating (overhead) expenses, thus accounting for movement in both revenues and operating costs.
While GOPPAR does not indicate the revenue mix of a hotel property and therefore does not show an evaluation of the individual departments, it does provide a clear indication of a hotel’s profit. Furthermore, GOPPAR can, in most cases, better reflect the profitability, management’s efficiency, and underlying value of hotel properties, as a whole. HVS London’s previous analysis illustrated that GOPPAR has a direct correlation of between 85% and 90% with a hotel’s value, while RevPAR has a correlation of approximately 70% to 75%. As such, GOPPAR provides a more reliable measure for hotel valuations when compared to RevPAR and should therefore be used as a more reliable basis for hotel investment analyses. A high RevPAR does not necessarily imply a high bottom line and thus a high value; while a high GOPPAR reflects a high bottom line as well as a more reliable indication of value for the property for ‘quick and dirty’ hotel investment analyses, as indicated in Table 2.
Table 2: GOPPAR Illustration
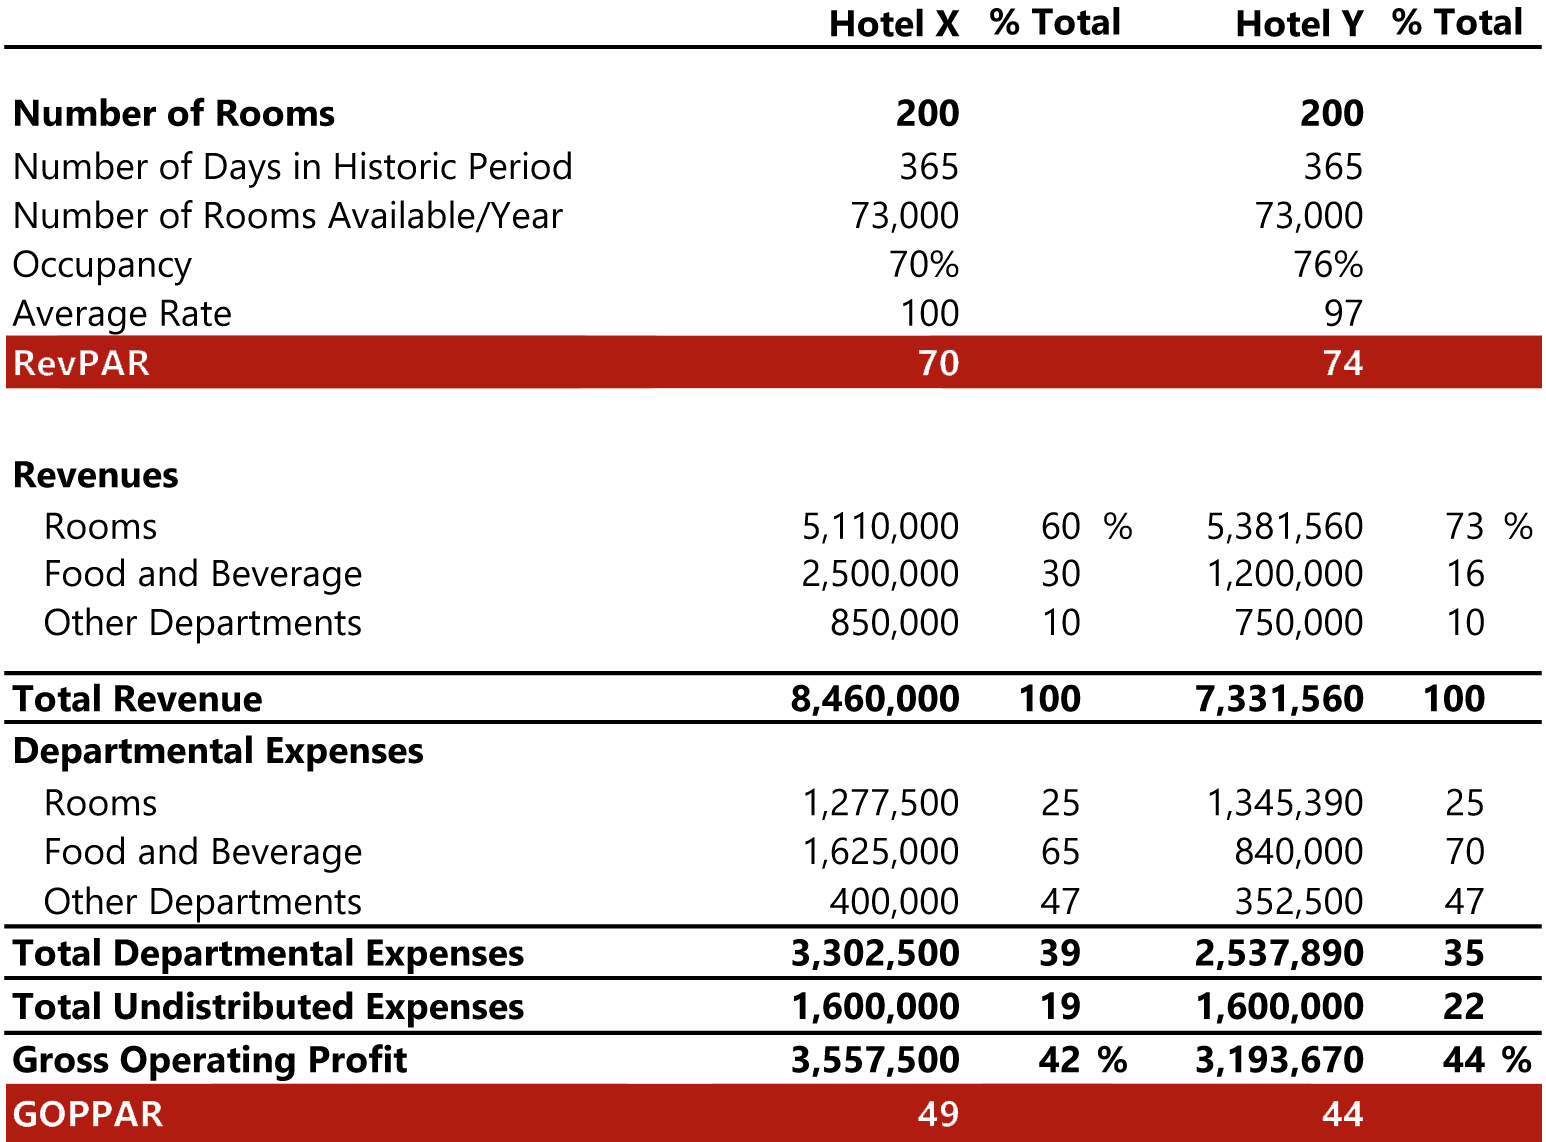
Source: HVS Research
In the above example, Hotel Y would appear to be the stronger performer when looking exclusively at RevPAR. However, owing to the significant contribution of F&B to GOP, Hotel X in fact has the stronger GOPPAR. All else being equal, this hotel would also likely have the higher value.
As mentioned earlier, for some hotels rooms revenue is less important and can account for only half of the total revenue or less. Additionally, there are many hotels which have significant space designated for conferences and banquets, lobbies and non-revenue-generating public spaces. KPIs such as GOPPAR and TRevPAR may look at a hotel’s performance in regard to its room inventory management; however, it is equally as important to measure and understand the profitability of the entire building. TRevPAR and GOPPAR better incorporate other income streams, but can only be used to show how the hotel is doing as a whole; they do little to inform management of what departments may be underperforming owing to the poor application of revenue management techniques.
RevPAM and GOPPAM
RevPAM and GOPPAM, as the names imply, are defined as a hotel’s total revenue or profit per available (square) metre. The following table illustrates the computation of RevPAM and GOPPAM for selected comparable hotels.
Table 3: RevPAM and ProPAM Illustration
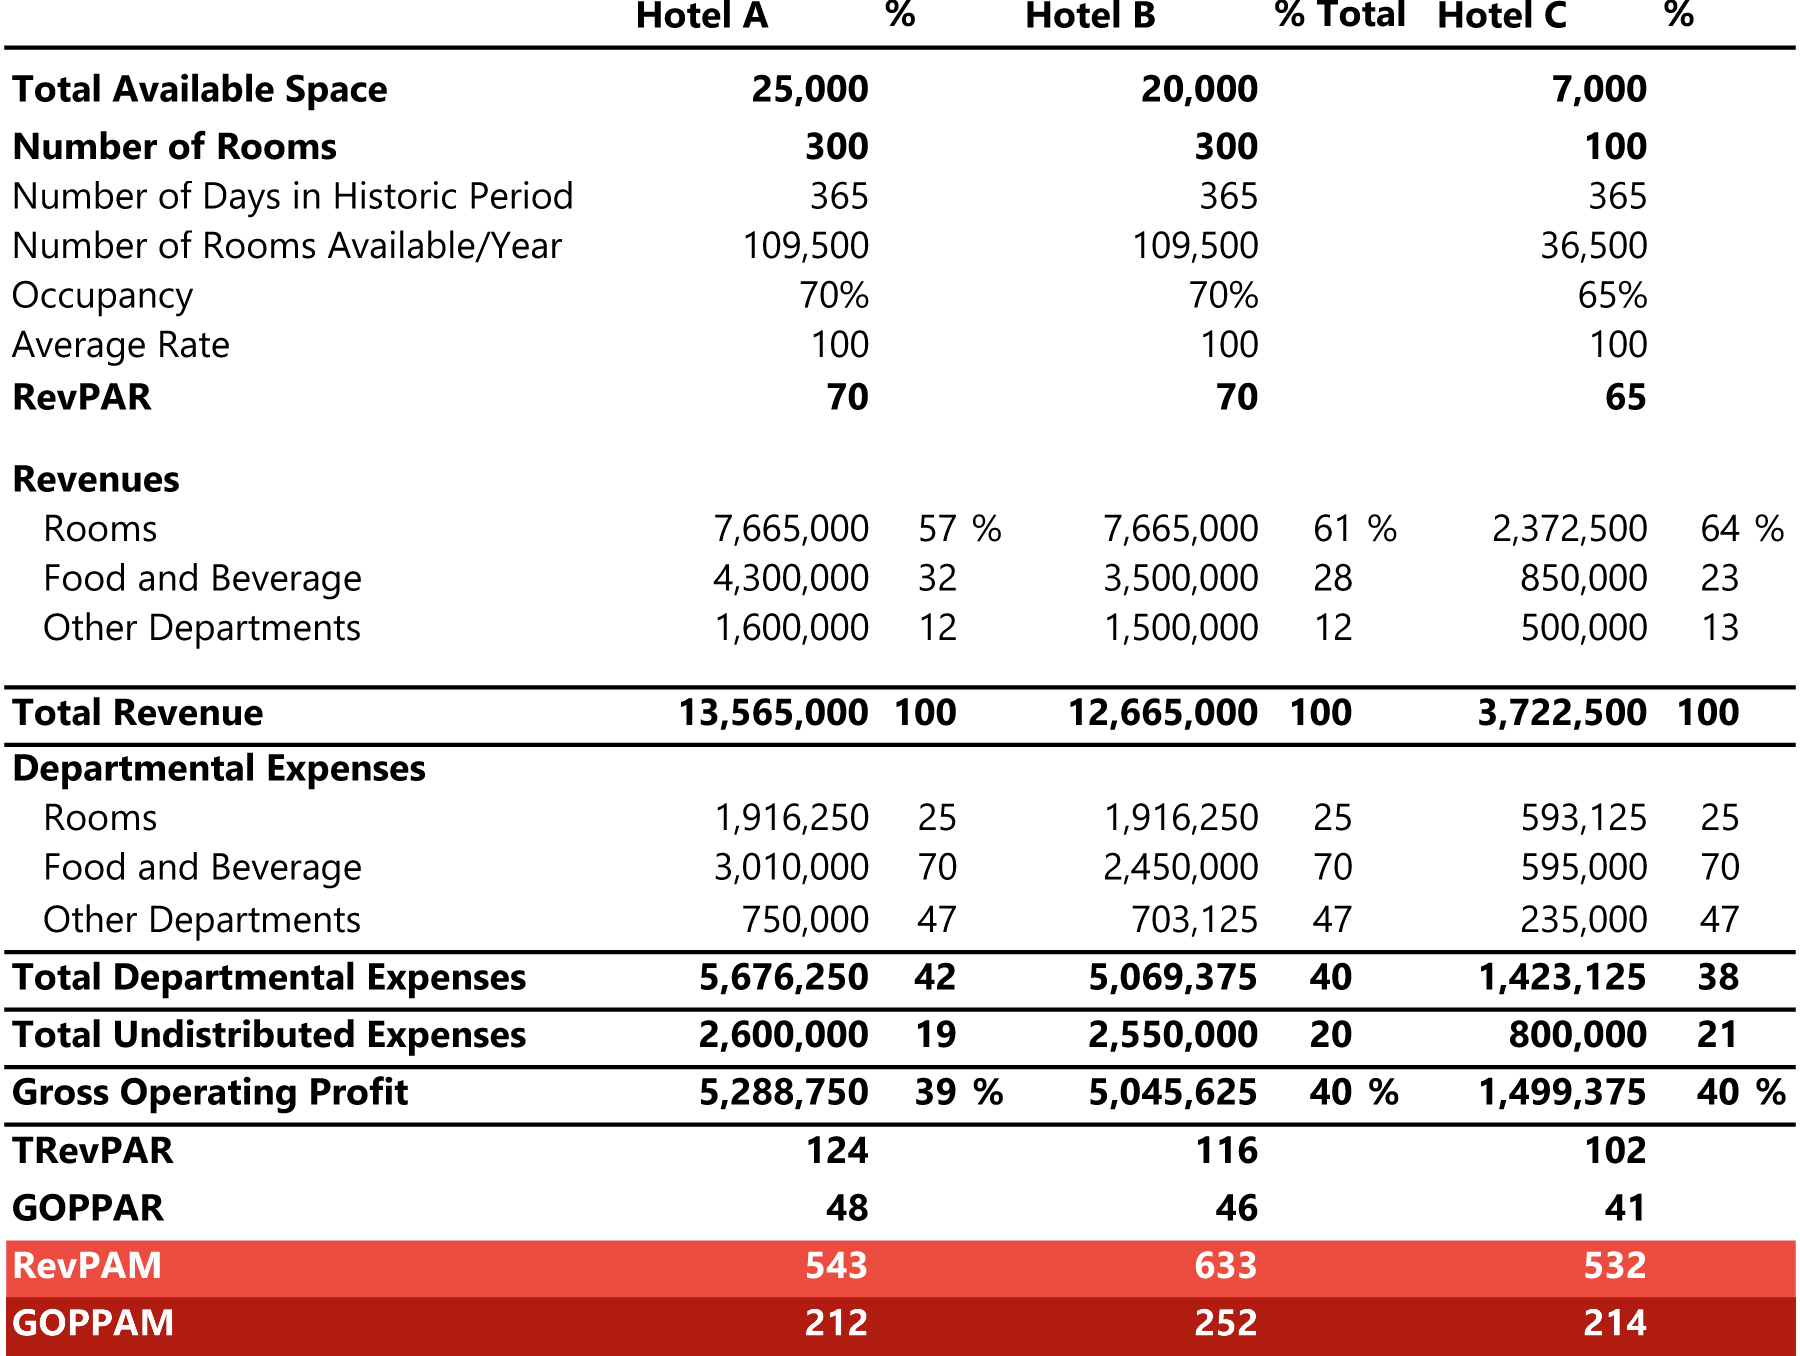
Source: HVS Research
A major benefit of using these two indicators as KPIs is that they take the entire space of the hotel into the equation, thus measuring the profitability of the building as a whole. Hoteliers can get more granular with their revenue management strategies, which becomes especially useful for hotels that generate incremental revenue through conferences and banqueting as these metrics are able to measure the utilisation efficiency of the entire property.
Hotels that have spaces that go beyond just accommodation need to focus on creating, promoting and optimising the offering that utilises those spaces. For example, as demonstrated in Table 3, Hotel A and Hotel B have an equal number of rooms (300) and perform at the same RevPAR of £70. Hotel A, however, has a larger conference & banqueting space and a total available space of 25,000 m². Hotel B, on the other hand, has a total available space of 20,000 m². With only 100 rooms and significantly fewer other spaces, Hotel C has a total available space of 7,000 m². Owing to the additional function space, Hotel A is able to generate more revenue resulting in a higher TRevPAR at £124, 7% more than Hotel B (£116) and 21% more than Hotel C (£102). In terms of GOPPAR, which accounts for all operating expenses, most of which include both fixed and variable portions, Hotel A is also overperforming by approximately 4% higher than Hotel B (£48 compared to £46) and 17% higher than Hotel C (£41).
However, if we take a look at the RevPAM and GOPPAM KPIs, which allow a hotel to measure the full impact of its revenue management strategies across all areas of the hotel, we can see that Hotel A is generating 14% less revenue and 16% less profit on a per available square metre basis than Hotel B. More interestingly, compared to Hotel C, Hotel A generates a higher RevPAM (+2%) but a lower GOPPAM (-1%).
This illustrates that RevPAM and GOPPAM do not always correlate with RevPAR or GOPPAR, and should be taken into account when evaluating a hotel’s financial health. Hoteliers and investors need to pay attention to these new KPIs during new builds and major renovations to optimise facilities and space, to drive ROI and ultimately optimise value per square metre. Many hotels face capacity utilisation issues as they attempt to maximise revenues because unused or misused spaces represent missed revenue-generating opportunities.
In the example of Hotel A, above, when the additional meeting space is not used for conferences or banqueting events, it could be used for instructor-led classes; wasted restaurant space can be transformed into an additional revenue-generating amenity for hotel guests; excess lobby space can be used to create a pop-up bar/kitchen which can attract in-house guests as well as local residents. Past case studies have shown how hoteliers can successfully be creative; for example, the conversion of three underutilised treatment rooms into a ‘gentlemen’s boxing club’, which both paid a rent to the hotel and required all members to purchase a spa membership to join. Other examples include outdoor spaces that have been optimised to drive additional revenue through the creation of rooftop terraces and garden bars; underutilised meeting rooms have been converted into rent-paying recording studios; and empty lobbies have become home to co-working spaces and pop-up stores.
Conclusion
Hotel operators need to learn to manage the entire building they operate, and speak the language of real estate investors, who typically measure performance as an amount per square metre. Since GOPPAM enables owners to compare their hotel’s performance with that of other real estate asset classes including offices, residential, retail, and so forth, it is more aligned with their overall interests. This is an essential step towards identifying dead or underperforming space and areas of the building with true potential for value creation. Effective and modern revenue managers must expand their focus from just the hotel’s rooms and put greater emphasis on the entire property. This would include creating other uses for spaces that are not driving any significant revenue. This will allow hoteliers to tackle two issues in one: optimising revenue and profit per square metre.
RevPAR and GOPPAR are effective and reliable indicators of a hotel’s performance; however, they may not provide the whole picture of a hotel’s business performance and don’t allow for comparability against other real estate asset classes. It’s time for hoteliers to not just brag about high ADRs, but to also focus on the revenue generation and profitability of the entire hotel, through the likes of RevPAM and GOPPAM.
1 Please refer to our 2003 publication, ‘GOPPAR, A Derivative of RevPAR!’ for more detail.
About Russell Kett
Excellent educational article Russell and Christopher that I will be sure the Executive Search team reads. Thank You both!