

A number of critical factors have converged to put the St. Louis hotel market firmly on the path of growth. The introduction of new hotel supply has been limited and should remain in check for the near term. Demand levels are expanding at a modest but steady pace, thanks to the strength and diversity of the city’s commercial, meeting and group, and leisure offerings. Hotel transaction activity has been steady in recent years, and values are expected to appreciate at a modest pace through 2017. Overall, the outlook for the market is positive, offering attractive opportunities for both hotel acquisition and development.
Hotel Market Performance
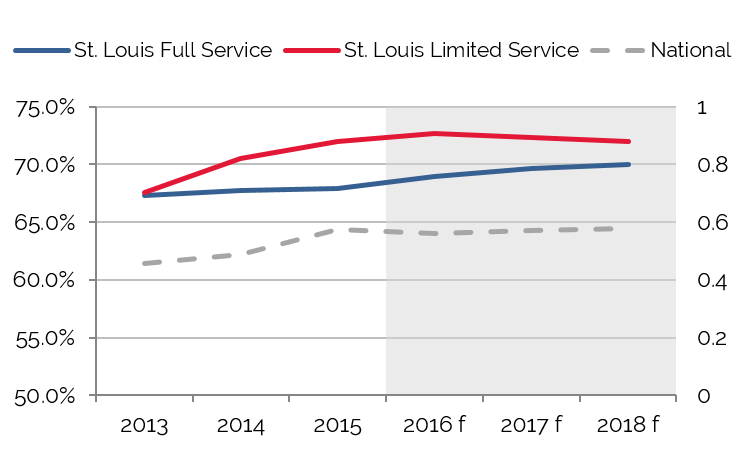
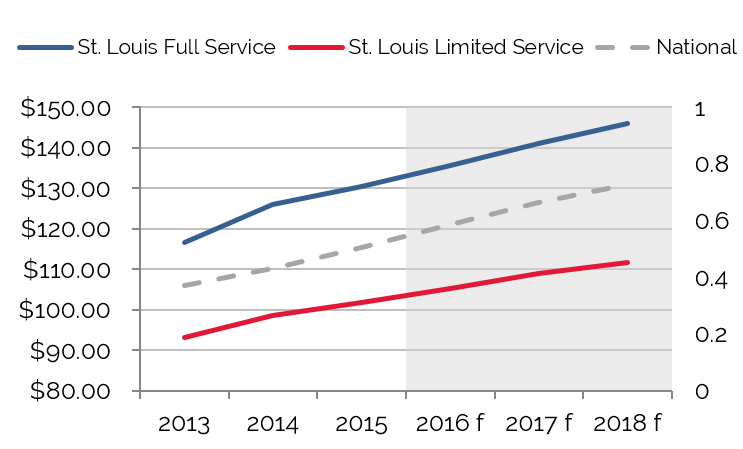
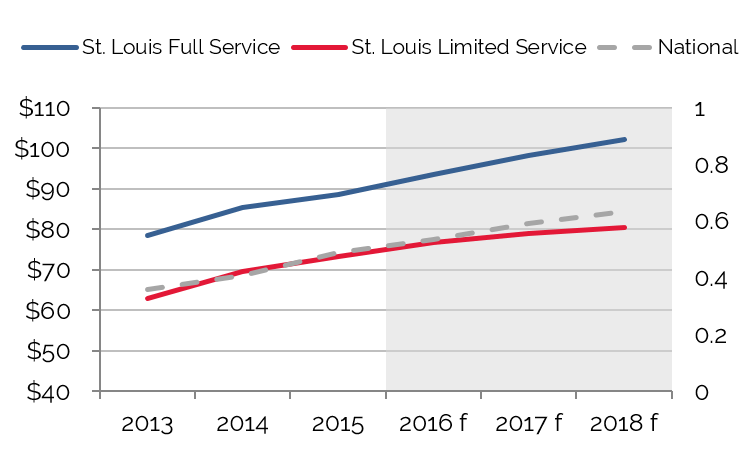
The following charts illustrate occupancy, average rate, and RevPAR trends for St. Louis hotels from 2012 through 2015; the forecast period spans 2016 through 2018. The illustrated trends reflect the performance of approximately 45 limited-service hotels and 40 full-services properties on which HVS tracks performance data. These hotels are primarily branded properties in the upper-midscale through luxury segments. The national data is provided by STR and reflects their estimates for all hotels across all segments.
St. Louis is in the Midst of Strong and Steady Growth
Occupancy has Steadily Improved
Healthy Average Rate Growth Continuing
RevPAR Growth has Accelerated
Source: HVS
The St. Louis market has experienced multiple years of healthy RevPAR growth for both limited and full-service properties. This trend aligns with the overall trend for the nation. Occupancy growth in recent years has been fueled by healthy increases in commercial and leisure demand, enhanced by multiple years of hotel supply decreases, as many obsolete properties have been shuttered or razed for redevelopment. These positive supply and demand trends have laid the groundwork for steady average rate growth. Although supply growth is turning positive in 2016, demand growth is more than keeping pace, which should allow for another year of healthy average rate and RevPAR increases for both limited and full-service properties. The market is anticipated to experience a trend of measured demand growth in coming years, fueled by a steady expansion of the regional economy, as detailed below. Meanwhile, supply growth is expected to accelerate in the near future, particularly in the upper midscale and upscale segments. As a result, limited service occupancy levels are expected to experience a modest correction, while full-service occupancy should register continued growth. These trends should allow the market to continue at a healthy pace of growth in the near term.
Existing Supply Breakdown by Brand and Scale
Hotels in St. Louis are fairly evenly distributed across the spectrum of chain scales, aside from a relatively limited number in the luxury segment. In contrast to the nation as a whole, St. Louis has a higher proportion of upper-upscale rooms versus rooms in the upscale segment.
St. Louis has a Relatively Even Distribution of Rooms across Chain Scales
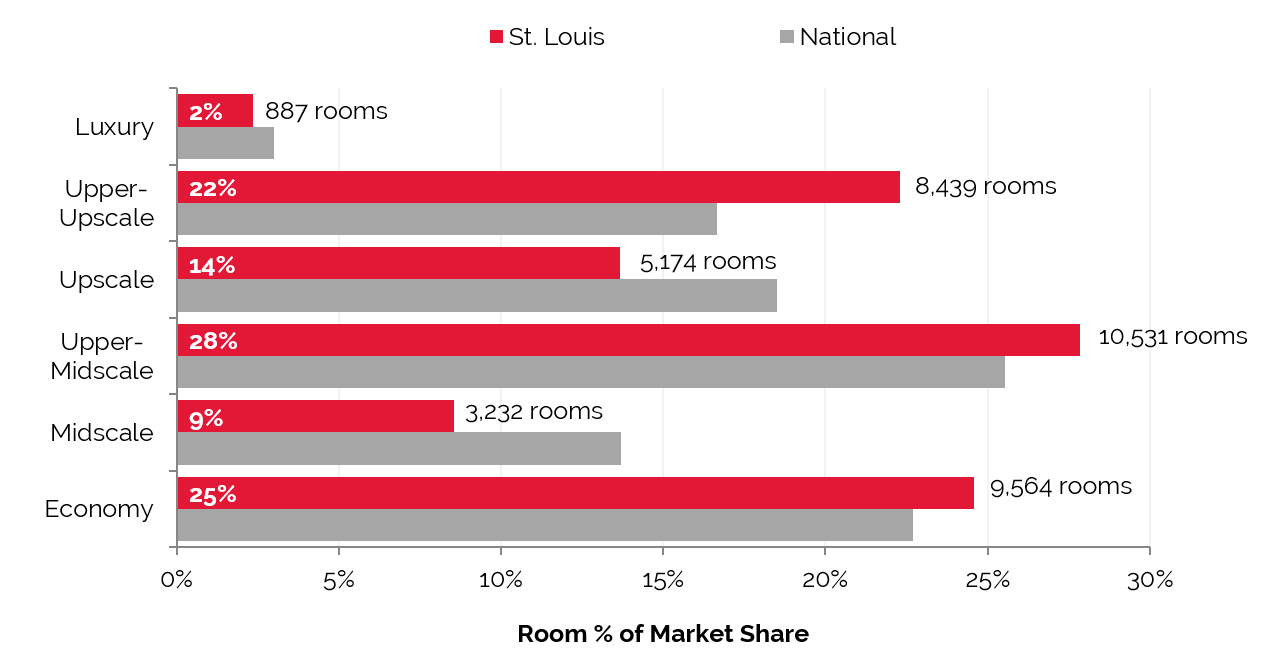
Source: STR
New Supply Pipeline
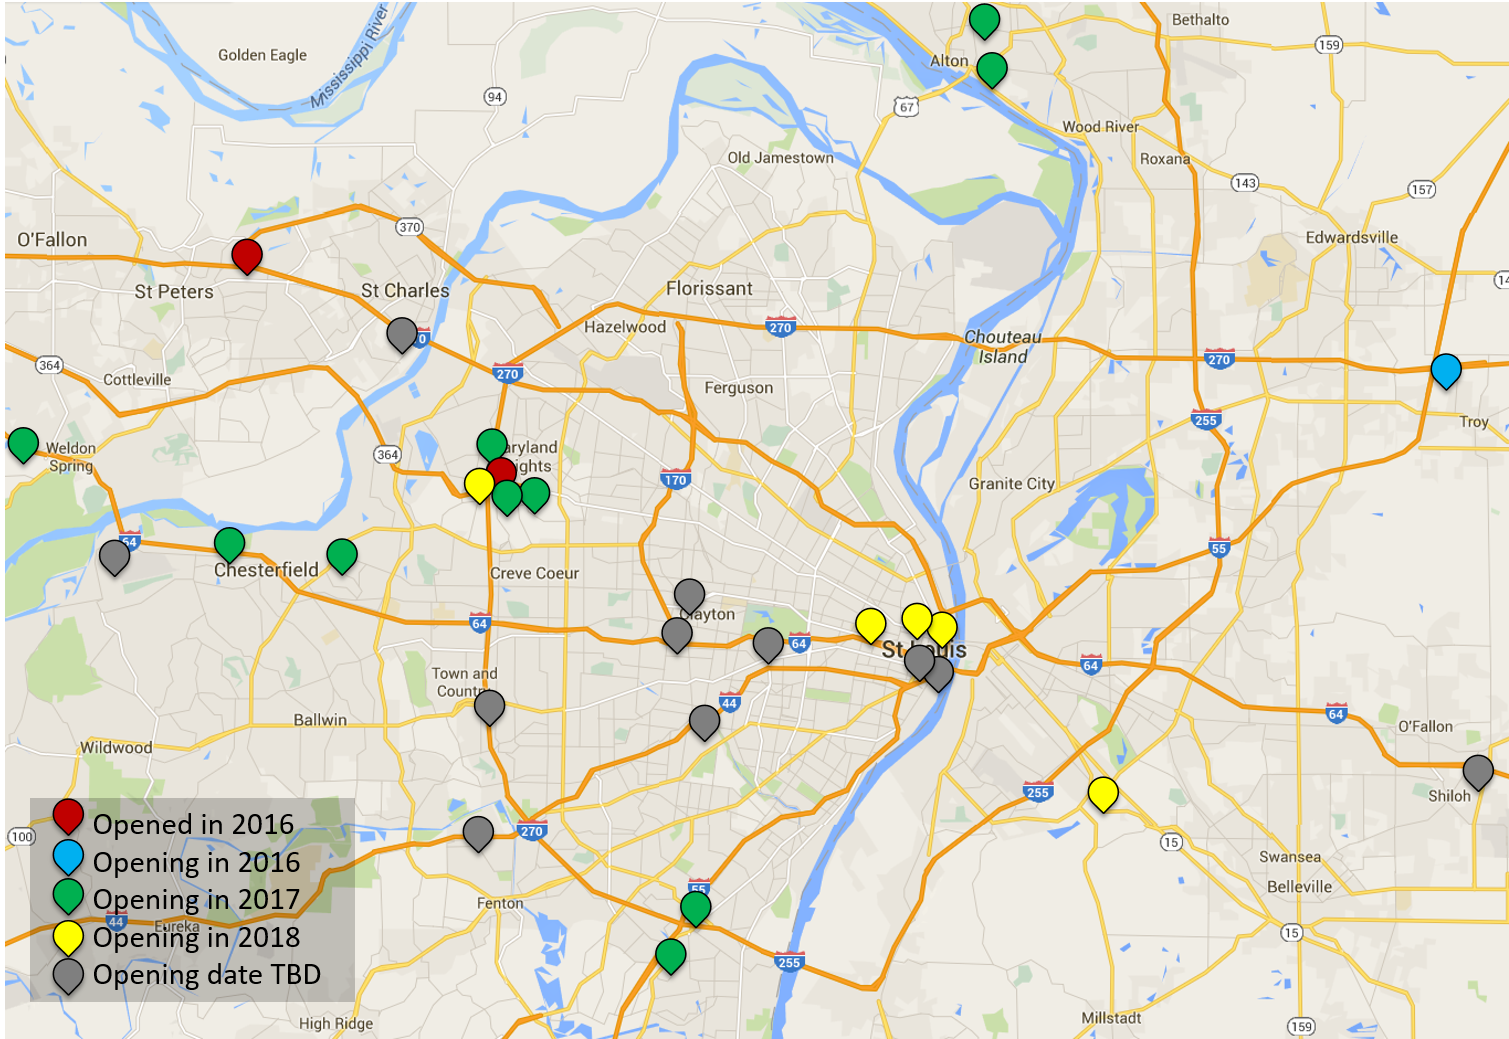
As market performance has improved over the last few years, the prospect of developing new hotel projects has become more feasible and attractive. However, rising construction costs and some lingering caution following the last market downturn have kept supply growth in check. While only three new hotel’s are slated to open in 2016, eight hotels that are expected to open in 2017 have broken ground or are already under construction; a few additional projects could also open in 2017 if they secure financing in coming months. All of the projects in active development are in suburban locations; however, multiple projects planned for the urban core are slated to open in late 2017 or early 2018. The majority of hotels in the development pipeline represents branded products in the upper-midscale and upscale segments. Additionally, a handful of upper-upscale lifestyle/boutique products have been proposed. All of the proposed projects are under 200-rooms; none of the planned developments include substantial meeting space components.
The table below reflects a supply pipeline of just over 2,200 rooms across 21 projects with announced room counts, as well as five proposed hotels with undetermined room counts. The figure of 2,200 rooms represents an approximate supply increase of 6.0%. We note that some of these projects are considered speculative or are still early in the development process and not all projects are expected to come to fruition; furthermore, the development timelines for those projects not yet under construction are likely to be extended.
Majority of Proposed Hotels Planned for Suburban Submarkets
Source: HVS
The pipeline of proposed hotels is quite evenly spread across multiple St. Louis submarkets. Unlike the last development cycle, which brought the addition of multiple large full-service properties to Downtown, the current new supply outlook for the urban core is limited to a few lifestyle/boutique projects of fewer than 200 rooms. Multiple developments are under construction or planned for the suburban Westport/Maryland Heights and St. Charles submarkets.
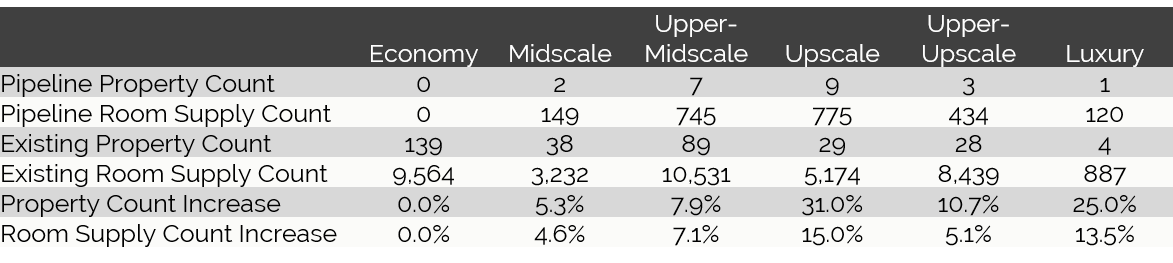
Of the property classes and room counts that have been determined, the following chart illustrates the class breakdown of the new supply in St. Louis.
Supply Growth to Occur Primarily in Upper-Midscale and Upscale Segments
Source: HVS, STR, and BuildCentral, Inc.
Hotel Valuation Expectation
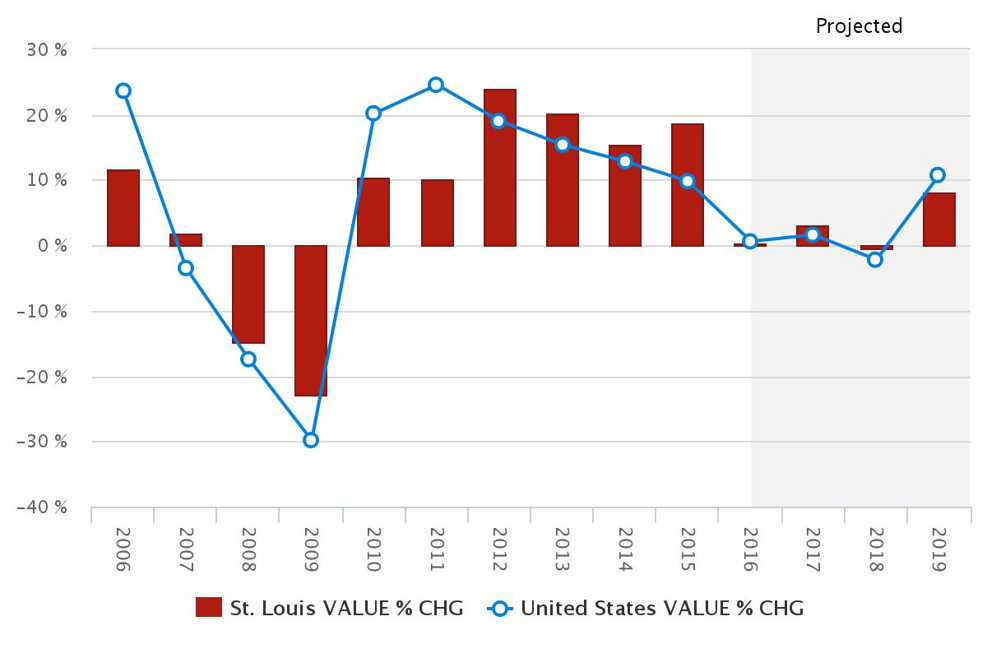
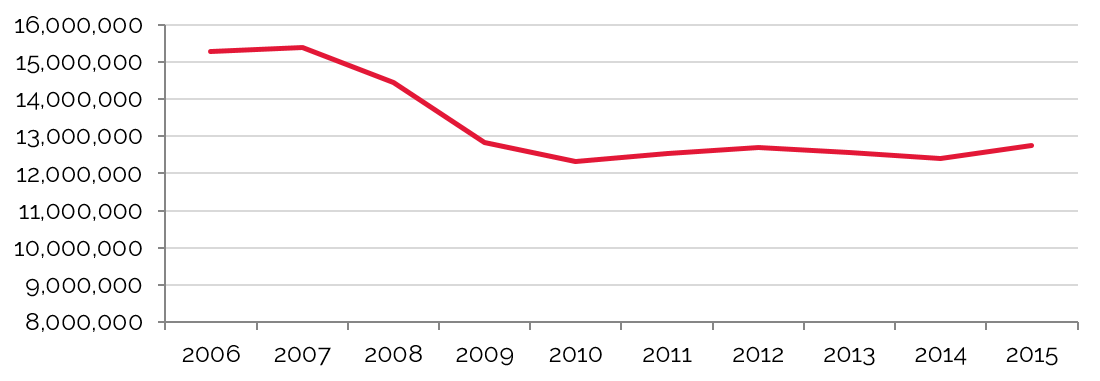
The annual U.S. Hotel Valuation Index (HVI) compiles data derived from over 4,500 hotel appraisal assignments each year, providing for analysis of performance and forecasts for hotel markets nationwide. The St. Louis market lagged the nation as a whole in the early post-recession recovery of 2010 and 2011. However, the market has benefitted from strong supply and demand fundamentals that have provided a foundation for strong RevPAR growth and value appreciation since 2012.
In 2015, the value of a typical hotel in St. Louis grew by approximately 19%, more than the average for the nation. In 2016, value growth is expected to decelerate, as the pace of local RevPAR growth has begun to slow and national capital markets have shown signs of constricting. St. Louis hotel values are anticipated to continue a trend of modest growth and value appreciation through 2019.
The following chart illustrates the trajectory of hotel values in St. Louis from 2006 through 2019.
Strong and Steady Growth Anticipated for St. Louis Hotel Values
Source: HVS & STR
St. Louis Hotel Values Expected to Keep Pace with the National Average

Ratings are comparable to 71 major U.S. cities evaluated in the HVS HVI.
Source: HVS & STR
Hotel Transactions
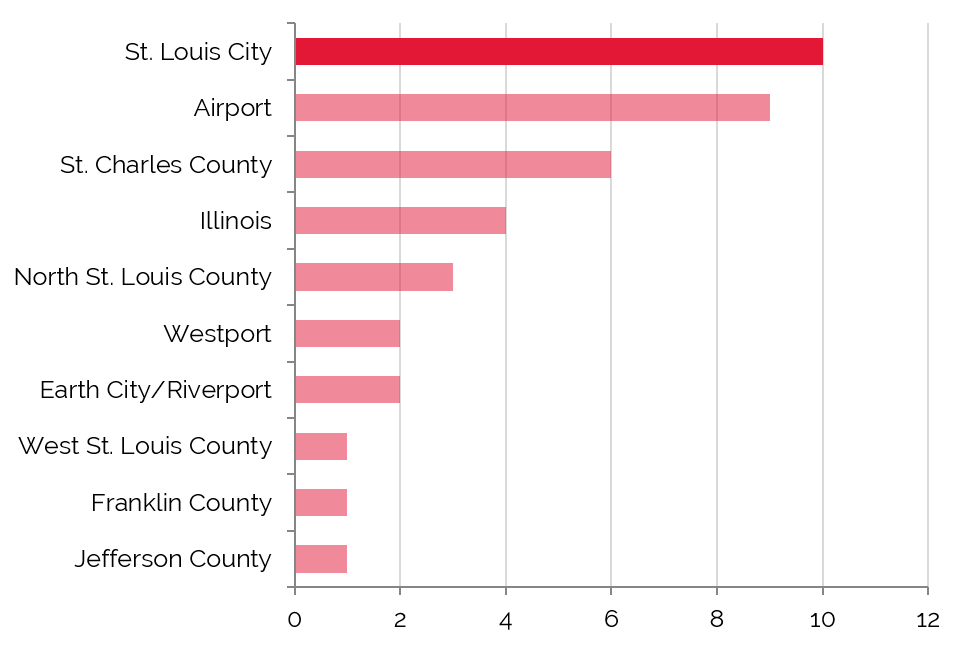
The following table details confirmed hotel transactions in the St. Louis market since 2013
St. Louis City has the Highest Number of Transactions
Average Price per room Around $50,000
Source: HVS & RCA
Transaction activity has remained relatively steady since 2013, with 10 to 15 sales occurring each year. Recent sales have comprised a mix of stabilized assets and hotels with significant upside potential for repositioning. Improvements in the hotel performance, along with increased attention from yield-hungry private equity investors, have continued to drive a steady sales pace. Although not represented in the tables above, two casino hotel transactions have taken place in the market in recent years; including the Four Seasons, Hotel Lumiere, and Lumiere Place Casino, which sold in April 2014 for $260 million. Pricing for underperforming or distressed properties in need of value-add investment has remained very attractive, although many of those opportunities have already been seized over the past 24 to 36 months. On the other hand, the market for high-quality select- and full-service assets remains strong, although the majority of current owners of those assets are buy-and-hold investors, limiting the inventory of assets available for sale.
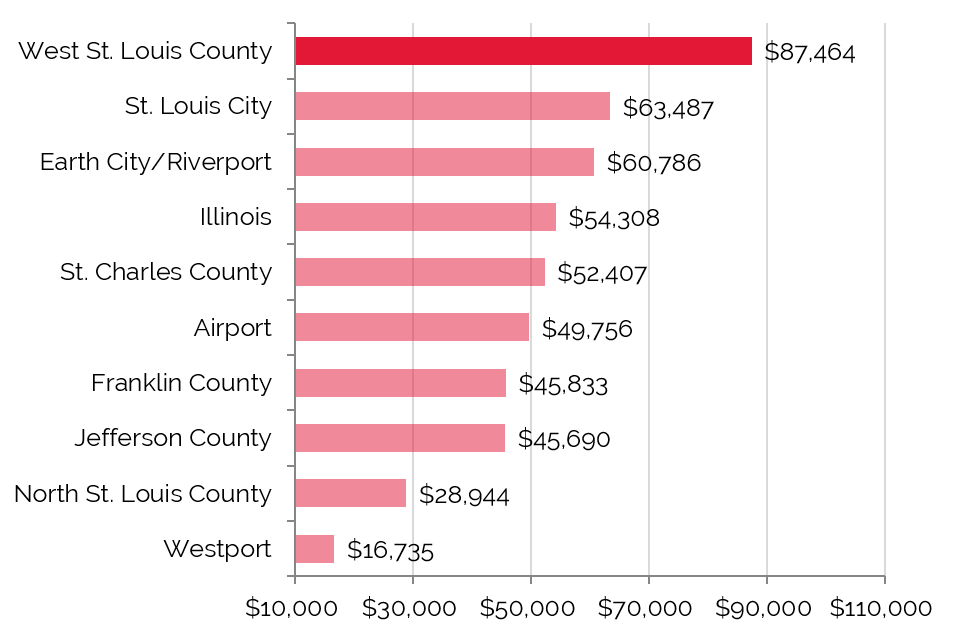
The price-per-key data reflects a mix of distressed or economy properties and stabilized hotels. Overall, the sales fell within a range of approximately $4,000 to $150,000 per room. The majority of the distressed and economy assets sold within a range of $15,000 to $45,000 per room. On the other hand, quality stabilized assets typically sold within a range of $85,000 to $150,000 per room. The majority of transactions have taken place in the St. Louis City and Airport submarkets, mirroring the highest concentrations of rooms within the greater market.
Across the nation, according to Real Capital Analytics, the lowest-priced confirmed hotel sale for the preceding three years was the Hotel Seagate in the Toledo, Ohio CBD at $2,830 per key. The next two lowest sales occurred in Chicago and Atlanta. The highest-priced confirmed sale, at $1.85 million per key, was the purchase of the Park Hyatt Hotel in the Manhattan Midtown West neighborhood.
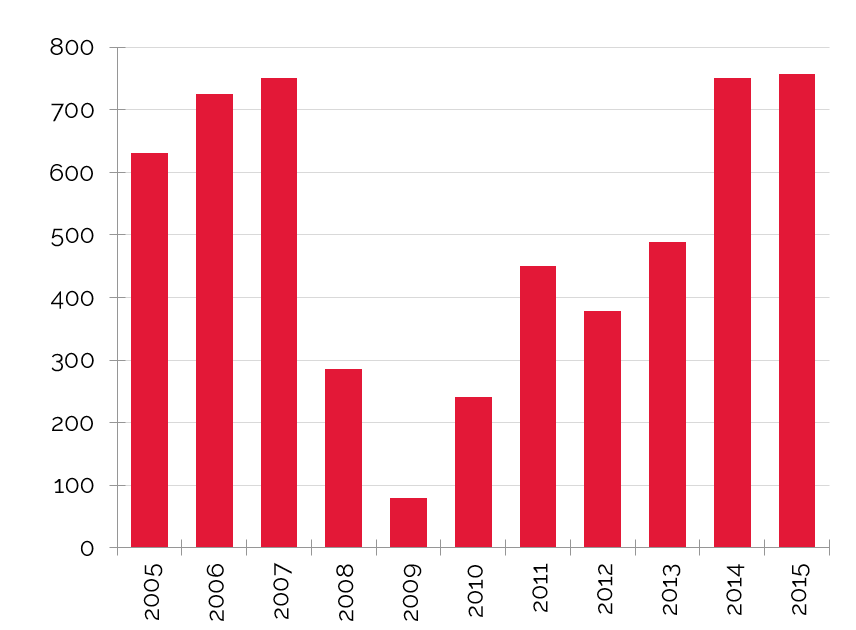
Average Price per Room in the U.S. Reaches Highest Point in Ten Years
Number of Major U.S. Sales ($10M and above)
Average U.S. Key Price Per Room
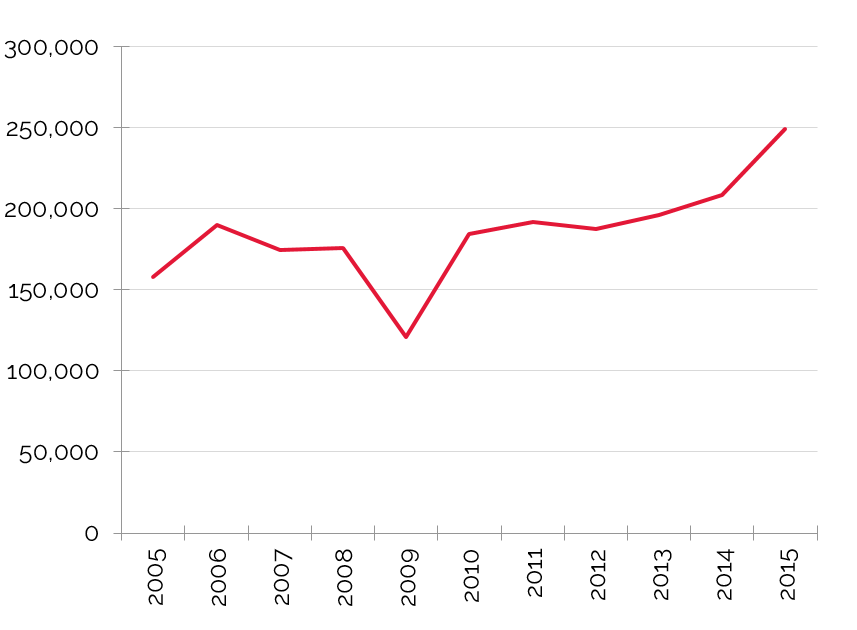
Source: RCA
Key Economic Indicators
Economic and Demographic Review
The U.S. population has grown at an average annual compounded rate of 0.9% from 2010 through 2015, and that rate is forecast to increase slightly to 1.0% into 2020. St. Louis County’s population growth lagged behind the country at 0.2%, but the overall St. Louis MSA registered a more healthy rate of 0.4% from 2010 to 2015; it is forecast to maintain that rate through 2020. This growth rate reflects the stable nature of the regional economy.
The average annual compounded growth rate of per-capita personal income for the county and MSA of 1.4% between 2010 and 2015 exceeded the national average of 1.2%. Anticipated growth into 2020 for the county is 1.5%, versus 1.3% for the nation. Anticipated growth into 2020 for the St. Louis MSA is forecast at 1.5%.
The national wealth index for the country trended flat from 2000 to 2015; it is anticipated to remain flat into 2020. Meanwhile, the county and MSA have experienced minimal growth in recent years and are expected to continue on a similar trend going forward. The wealth index for St. Louis County is notably above the national and state levels. Although somewhat lower than St. Louis County, the wealth index for the entire MSA is still above those of the national and state.
Food and beverage sales in the county grew at an annual compounded rate of 1.5%, with $1.836 billion in 2010 and $1.973 billion in 2015. Through 2020, the pace of growth is expected to moderate slightly to 1.1% for the county. The entire St. Louis MSA had a similar average annual compounded growth rate of 1.5% from 2010 to 2015.
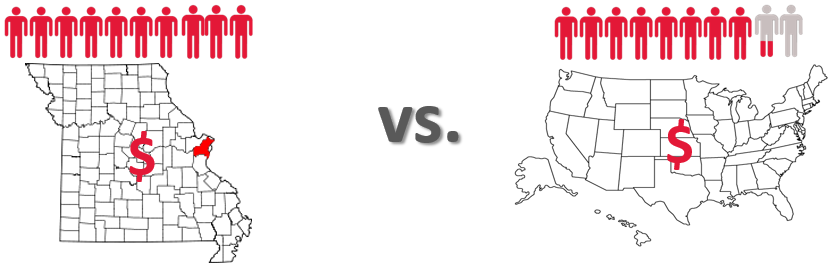
St. Louis' MSA average annual compounded growth rate of resident population has been 60% lower than that of the nation.
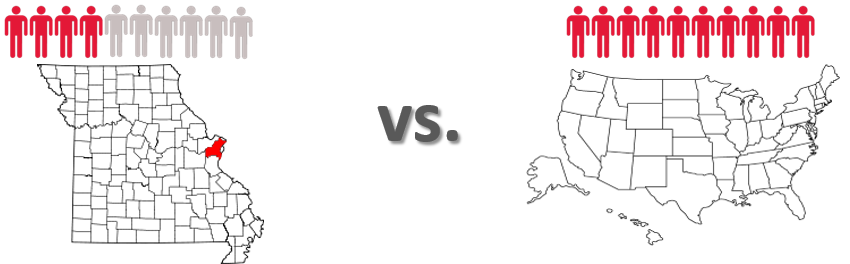
Average annual compounded growth rate of per-capita personal income for the MSA was 13% higher than that of the nation in 2010-2015 period.
"Map of Missouri highlighting Saint Louis County" by David Benbennick - The maps use data from nationalatlas.gov, specifically countyp020.tar.gz on the Raw Data Download page. The maps also use state outline data from statesp020.tar.gz. The Florida maps use hydrogm020.tar.gz to display Lake Okeechobee.. Licensed under Public Domain via Commons - https://commons.wikimedia.org/wiki/File:Map_of_Missouri_highlighting_Saint_Louis_County.svg#/media
/File:Map_of_Missouri_highlighting_Saint_Louis_County.svg
/File:Map_of_Missouri_highlighting_Saint_Louis_County.svg
The retail sales sector for the county and MSA as a whole demonstrated similar average annual compounded growth rates from 2010 to 2015 at 1.8% and 1.9%, respectively. Those rates are expected to moderate to 1.2% and 1.3% through 2020, reflecting a trend of steady growth.
Workforce Characteristics
The characteristics of an area’s workforce provide an indication of the type and amount of transient visitation likely to be generated by local businesses. Sectors such as finance, insurance, and real estate [FIRE]; wholesale trade; and services produce a considerable number of visitors who are not particularly rate-sensitive. The government sector often generates transient room nights, but per-diem reimbursement allowances often limit the accommodations selection to upscale and mid-priced lodging facilities. Contributions from manufacturing, construction, transportation, communications, and public utilities [TCPU] employers can also be important, depending on the company type.
From 2000 to 2010, total employment in the MSA remained relatively stable. The pace of employment growth improved to 1.1% on an annual average from 2010 to 2015. Woods & Poole Economics, Inc. anticipates total employment in the MSA to maintain that average annual rate of change through 2020.
The finance, insurance, and real estate [FIRE]; wholesale trade; and services employment sectors represented 66.2% of total employment in the St. Louis MSA in 2015, with an average annual compounded growth rate expected to be approximately 1.1% into 2020; as stated above, these sectors are important drivers of demand to higher-rated hotels.
The largest primary employment sector in 2015 was Total Services, which recorded the highest rise (32,000) in number of employees during the period from 2010 to 2015. Of the various sub-sectors included in Total Services, Health Care and Social Assistance and Retail Trade were the largest employers.
Employment Projections through 2020 Show Impressive Growth in Total Services, Total Government and Total Trade
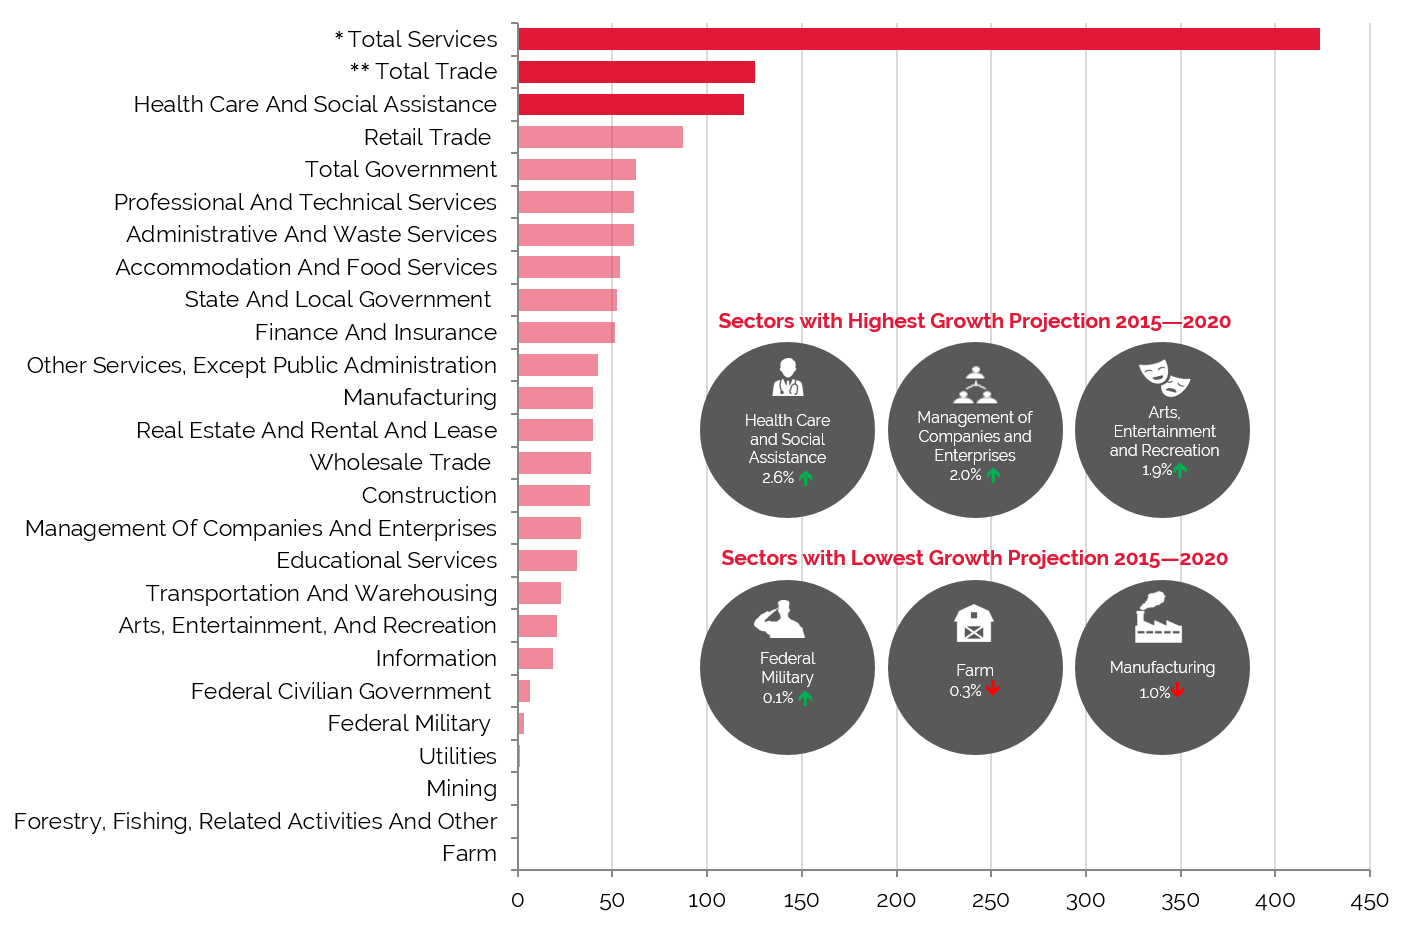
Source: Woods & Poole Economics, Inc.
* Total Services include: Professional and Technical Services; Management of Companies and Enterprises; Administrative and Waste Services; Educational Services; Healthcare and Social Assistance; Arts, Entertainment, and Recreation; Accommodation and Food Services; and Other Services, except Public Administration
** Total Trade includes Wholesale Trade and Retail Trade
Employment
The St. Louis area benefits from a diverse economy that provides a strong foundation for steady economic growth. The area continues to be anchored by strong healthcare, education, and government sectors. Within the healthcare sector, companies such as Express Scripts and Centene have continued to grow and expand. Although the manufacturing industry, a traditional cornerstone of this market, has faced some difficulties in the past, General Motors completed a major expansion of its Wentzville plant in 2013 and has since expanded its workforce by over 1,200 employees. Furthermore, the aerospace manufacturing industry remains strong, owing to the presence of Boeing's Defense, Space, & Security operations.
The St. Louis area is now emerging as a center for research and development in the bio- and life-science sectors, anchored by the local operations of such companies as Monsanto, Pfizer, and Mallinckrodt. Financial services also make up an important component of the local economic base, including companies such as Wells Fargo Advisors, Edward Jones, Scottrade, and Stifel. Lastly, the area is home to the headquarters of numerous national and international consumer goods and services firms including Nestlé Purina PetCare, Anheuser-Busch InBev, Enterprise Holdings, Caleres, Emerson, Panera, Build-A-Bear, Energizer, and Rawlings.
The following table illustrates historical and projected employment, population, and income data for the overall St. Louis market as presented by REIS.
Historical & Projected Employment, Households, Population, and Household Income Statistics for St. Louis MSA
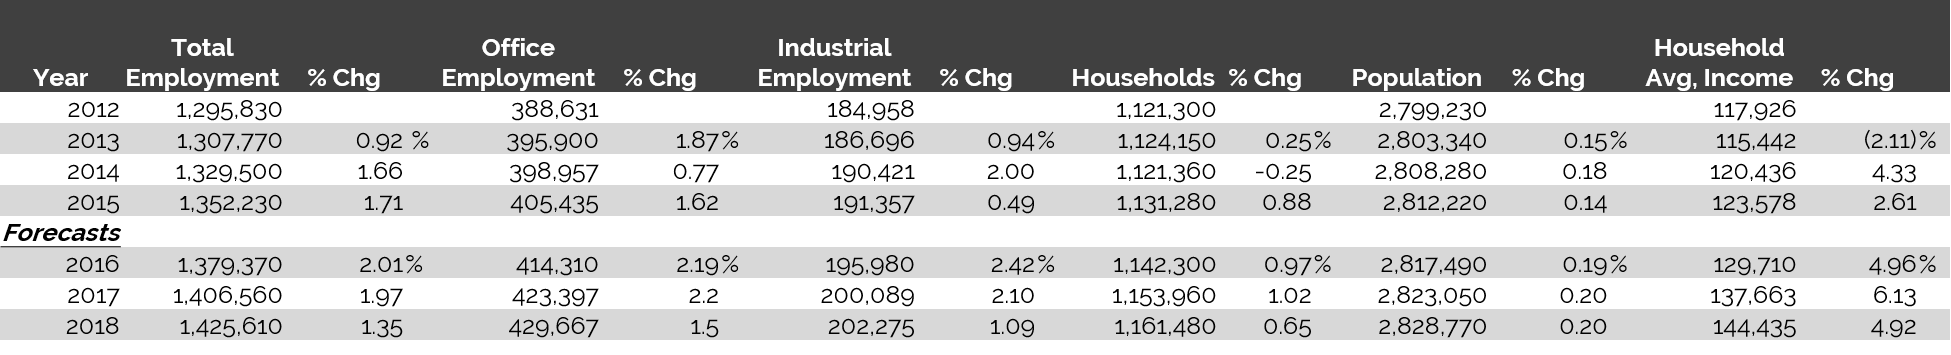
Source: REIS Report, 1st Quarter, 2016
Top Industries In St. Louis
The following table presents a list of the major employers in the market:
Major Employers in St. Louis
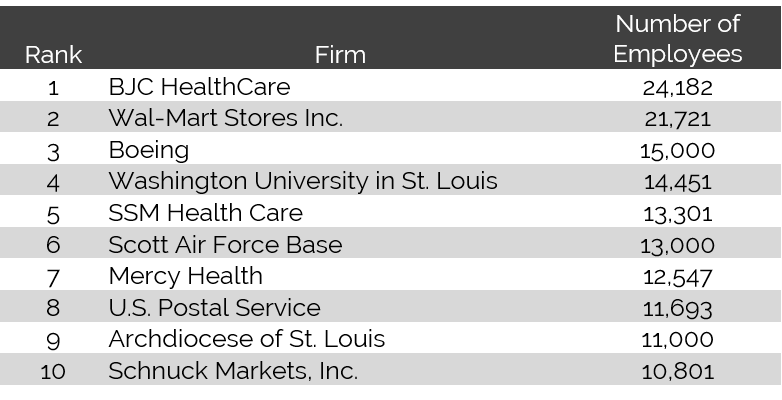
Source: St. Louis Regional Chamber & Growth Association, August 2016
The greater St. Louis economy relies heavily on the financial services sector. Companies and entities such as Wells Fargo Advisors, U.S. Bank, Stifel Financial Corporation, and the Federal Reserve Bank of St. Louis all maintain a presence Downtown. Other major financial companies such as Scottrade, RGA, and Edward Jones also maintain headquarter operations in the greater St. Louis market. The region became a direct beneficiary of the financial crisis in 2008 and 2009, as financial companies relocated to the area seeking more cost-effective locations for their operations. As a result, local employment within the sector grew 85% between 2007 and 2012. In 2016, Edward Jones completed the construction of a new $100-million office building and parking garage at the company's suburban St. Louis campus. The expansion is anticipated to create as many as 1,000 new jobs. In 2014, RGA completed its new $150-million headquarters in Chesterfield in order to accommodate continuing employment growth.
Positioned in the heart of a region known as the “BioBelt,” St. Louis is home to Monsanto, one of the world's largest agri-business companies. Monsanto has been at the forefront of research and innovation related to agricultural crop breeding, trait selection, and genomics, which has allowed it to become one of the world's leading producers of seeds and crop-protection products. In 2013, Monsanto undertook a $400-million expansion of its research and development campus that will bring an estimated 675 new jobs to the area through 2016. Pfizer, a current tenant at the Monsanto research campus, announced in 2016 that the company is evaluating multiple sites in the St. Louis region for a planned expansion of its operations.
The area around Lambert-St. Louis International Airport is home to a number of aviation and aerospace institutions. St. Louis is the headquarters for Boeing’s Integrated Defense Systems (IDS) unit, the company’s largest subsidiary responsible for defense and aerospace products. The third-largest employer in St. Louis, IDS is a $32.4-billion business with roughly 72,000 employees worldwide. In recent years, Boeing has undertaken an expansion and diversification of its local operations. In 2014, Boeing opened new IT and R&D facilities in St. Louis. Later that year, Boeing broke ground on a new 367,000-square-foot composite center at its existing campus. The new facility is scheduled for completion in 2016; it will produce parts for the new Boeing 777X twin-engine jet and is expected to create 700 new jobs. The new line will be the company's first commercial aircraft production initiative in St. Louis.
One of the fastest-growing companies in St. Louis has been Express Scripts, a pharmaceutical benefit manager. The Fortune 100 company manages pharmaceutical benefits for over 50 million employees and their families. Between 2007 and 2011, Express Scripts completed four new facilities at its growing headquarters campus. In total, these buildings represent an investment of over $210 million and comprise over 730,000 square feet of new office space, as well as a new distribution center. In December 2009, the company closed on its $4.675-billion acquisition of WellPoint's NextRx subsidiary, and in April 2012, it acquired Medco Health Solutions for $29.1 billion. Express Scripts is now the largest company of its kind in the country. In July 2014, the company completed its most recent expansion, a 224,000-square-foot building at an estimated cost of $56 million. The company also announced plans to add over 1,500 new jobs at the headquarters by 2018.
Another rapidly expanding healthcare firm is Centene, a benefits and care manager that is based in Clayton. The firm serves nearly 3 million patients across 21 states. In 2016, Centene acquired Health Net, another insurance provider and care coordinator, in a $6-billion merger. Also in 2016, the company unveiled plans for a massive expansion of its Clayton campus. The phased $780-million development would include nearly 1.5 million square feet of office space, as well as retail, a hotel, and an auditorium.
BJC HealthCare and SSM Health Care are two of the area’s largest employers, operating multiple hospital facilities throughout greater St. Louis. These facilities, including two that are affiliated with prestigious medical school programs at area universities, offer numerous specialty services and clinics, as well as full-service hospitals. The BJC medical complex is in the midst of a $1-billion renewal project; upon completion in 2020, the project will have added 1.5 million square feet of building space to the three medical facilities. Meanwhile, SSM took over operations of St. Louis University Hospital in September 2015 and announced plans to redevelop the campus over the coming five years at an estimated cost of $500 million. The investment will include a new 365-bed hospital and ambulatory care center, as well as capital improvements to existing facilities.
Unemployment
Unemployment rates in this area fluctuated in the middle of the last decade as some area industries strengthened while others downsized. Concurrent with statewide and national trends, local unemployment rates increased in 2008 and 2009. In 2010, local unemployment levels stabilized, and unemployment levels fell from 2011 through 2015. The most recent comparative period illustrates continued improvement in 2015. Reportedly, local employment has remained strong within the healthcare, financial services, and high-tech sectors, including healthy job numbers at major employers such as BJC HealthCare and Wells Fargo Advisors.
St. Louis Unemployment has Fallen Each Year since 2009 Peak
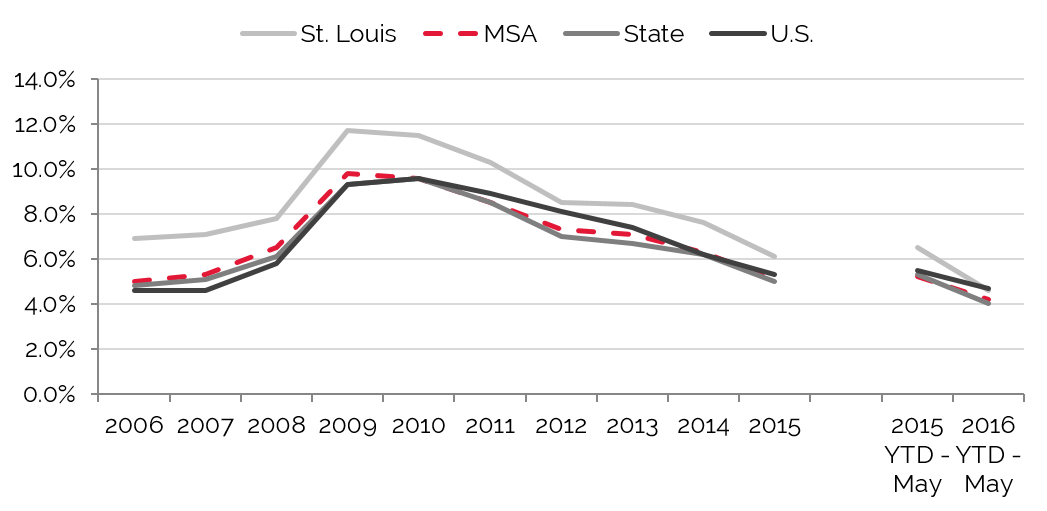
Source: U.S. Bureau of Labor Statistics
Office Space
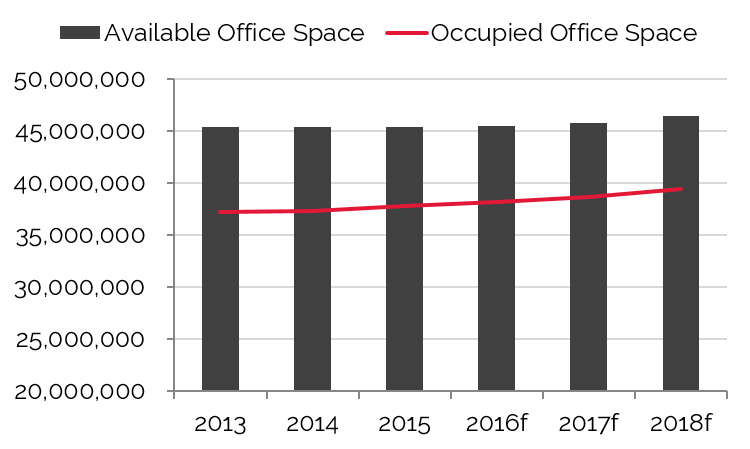
Trends in occupied office space are typically among the most reliable indicators of lodging demand, as firms that occupy office space often exhibit a strong propensity to attract commercial visitors. Thus, trends that cause changes in vacancy rates or in the amount of occupied office space may have a proportional impact on commercial lodging demand and a less direct effect on meeting demand. The following table details office space statistics for the pertinent market area.
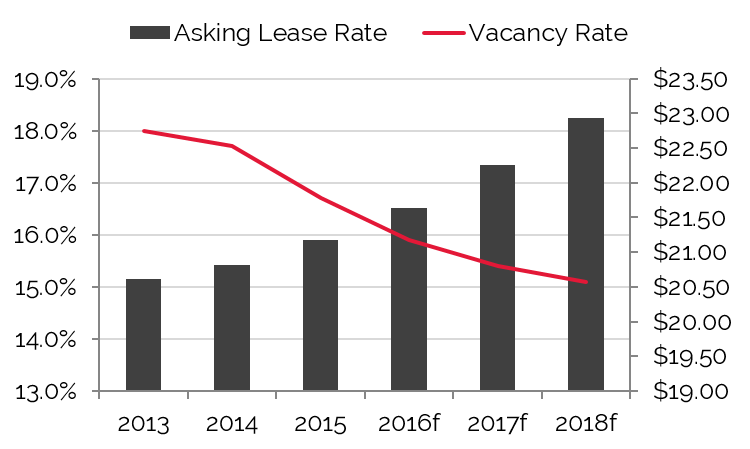
The overall St. Louis office market has shown modest improvement over the last few years, with vacancy rates declining slightly from 2012 through 2015. Meanwhile, overall rental rates have shown steady, albeit modest, growth over the last several years. New development in the office sector is expected to remain modest over the next two years, which should positively affect vacancy and lease rates.
Clayton, Highway 40 Corridor Submarkets Command Highest Rates and Lowest Vacancies
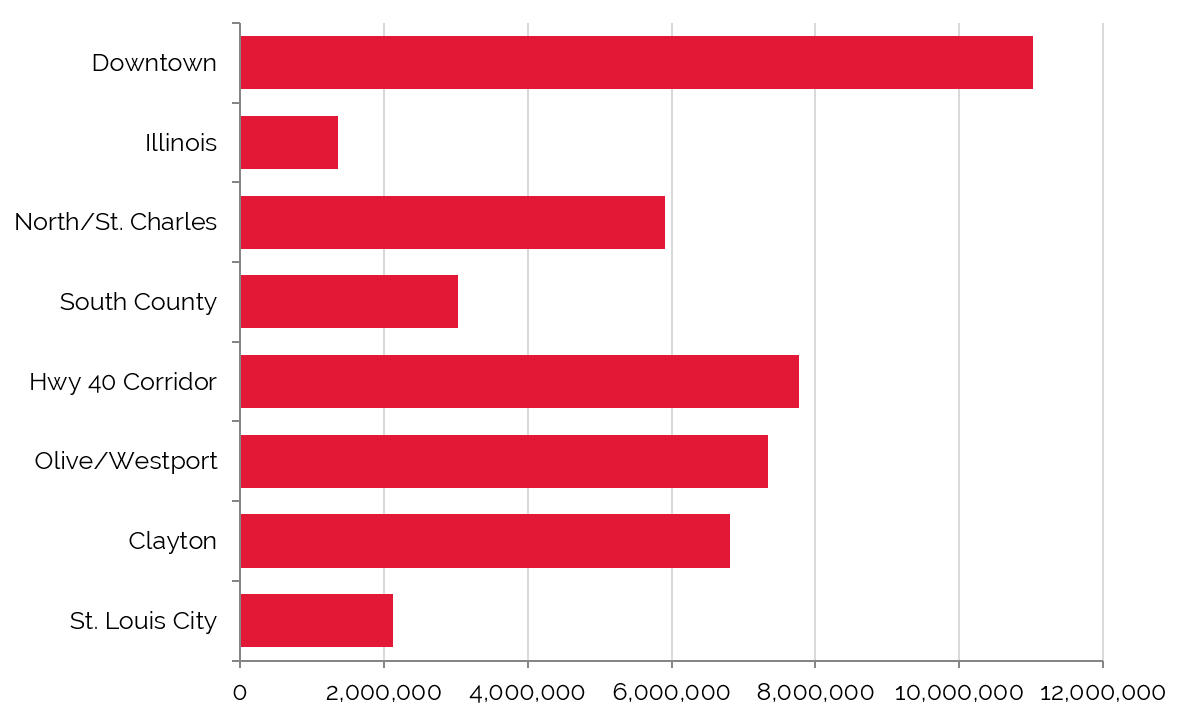
Source: REIS Report, 1st Quarter, 2016
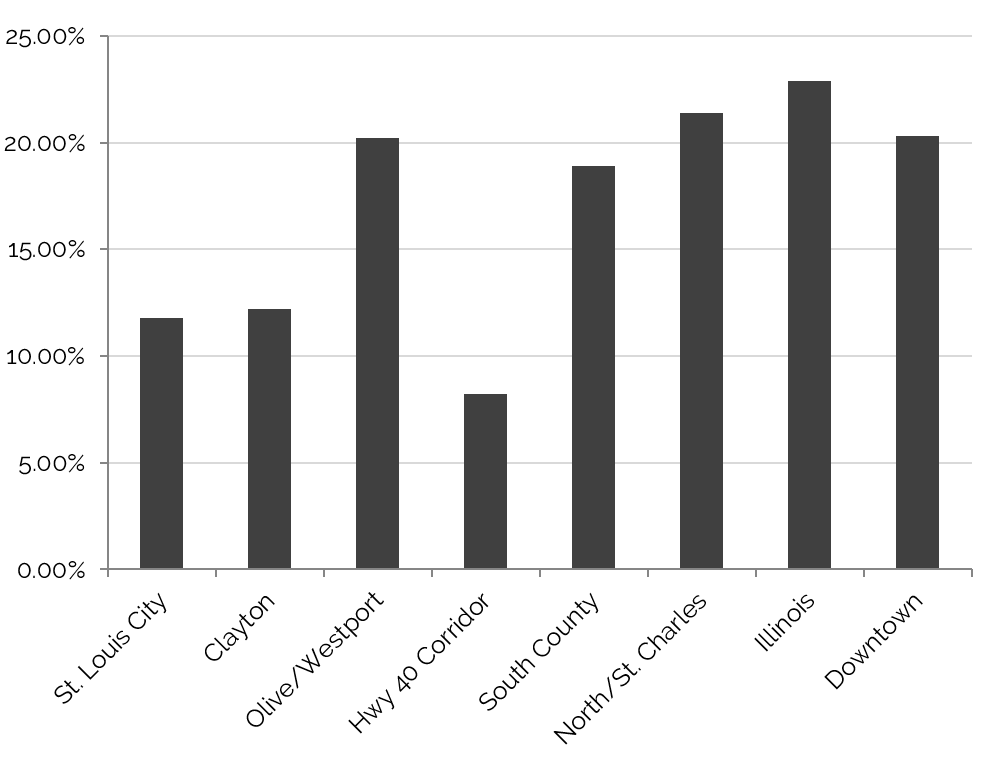
The Downtown office submarket, the largest by volume of space in the region, remains somewhat weaker than the market as a whole, in part due to limited development over the last decade and the lack of first-class space in the submarket. Despite these challenges, the submarket remains home to some of the region’s largest corporate offices, including major financial firms and consumer product companies such as Nestlé Purina PetCare, Stifel, and Wells Fargo Advisors. Additionally, the Downtown submarket benefits from a growing high-tech industry, in part due to the presence of the T-Rex tech incubator, which houses over 100 startups. The adjacent Midtown district is home to the Cortex innovation community, another tech-focused development. The growing district is also home to offices for Pandora, Square, Boeing, and a Center for Emerging Technology.
The highest-performing office submarkets in St. Louis are located west of Downtown, along the Interstate 64/Highway 40 corridor. Clayton serves as the government seat for St. Louis County and as a second central business district for the region. The Clayton submarket is home to operations for numerous regional and national financial institutions and law firms, as well as corporate headquarters for companies such as Centene, Enterprise, and Caleres. Farther west, the office market along the length of the Interstate 64/Highway 40 corridor is strong and diverse.
Anchored by multiple major hospitals, the market is home to numerous medical office buildings, rehabilitation centers, and outpatient surgery clinics, as well as corporate headquarters for companies such as RGA, Scottrade, and Rawlings. To the north of the Highway 40 corridor, the well-established Olive/Westport market is in the midst of revitalization, including the recent expansions of the Edward Jones headquarters campus and the ongoing development of a new headquarters office for Worldwide Technology.
Hwy 40 Corridor has the Lowest Vacancy Rate in the Region
Clayton Leads Average Asking Lease Rate
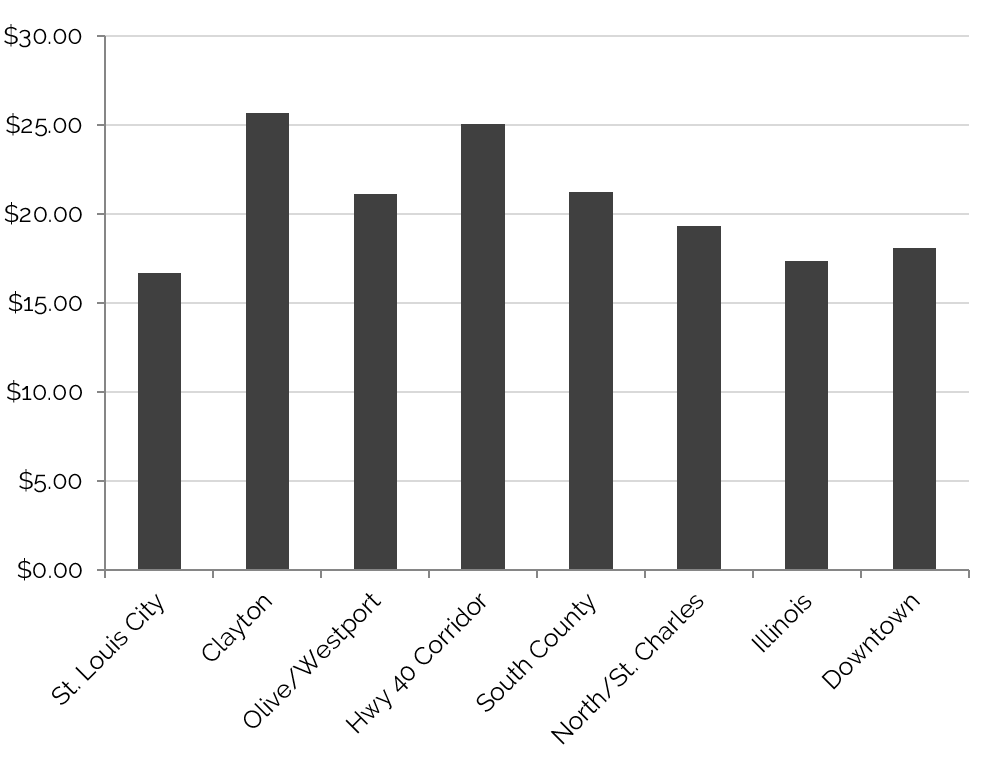
Source: REIS Report 1st Quarter, 2016
Available and Occupied Office Space to Experience Gradual Growth
Vacancy Rate Should Drop until 2017
Source: REIS Report 1st Quarter, 2016
Convention Activity
Convention centers generate significant levels of demand for area hotels, particularly those within a radius of three miles. Convention headquarter hotels command premium rates and, in addition to capturing event-related demand, can also benefit from hosting related banquet events. Major conventions also push demand to peripheral hotels in the market.
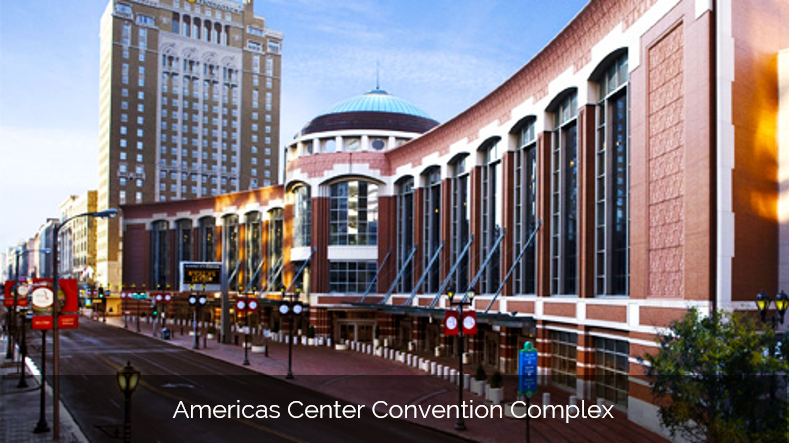 America's Center, which includes the St. Louis Executive Conference Center and the Edward Jones Dome, is the area's primary meeting venue. The center, which was expanded in 1993, now provides more than 500,000 square feet of prime exhibit space. The Edward Jones Dome, a convention facility and stadium that was formerly known as the Trans World Dome, seats over 64,000. The St. Louis Executive Conference Center is located on the third floor of the America's Center. It is reportedly the only conference center in the U.S. located inside a convention center and certified by the International Association of Conference Centers. In 2010, the Convention & Visitors Commission (CVC) embarked on a $48-million renovation of the convention center. The project, which was completed in 2012, included upgrades to the roof, escalators, elevators, life-safety systems, HVAC system, kitchens, restrooms, signage, and interior finishes.
After a banner year in 2006, the number of conventions trended downward until 2012. The number of booked room nights generally fluctuated before notably increasing in 2012, as the convention center benefited from demand returning to the market and the completion of its renovation. The total number of events and booked room nights fell slightly in 2013. The number of events and room nights increased significantly in 2014 and 2015, rising to the highest levels on record. The recent improvement has been supported by renovations at several larger full-service hotels, as well as multiple new large conventions that were secured through 2017. According to the CVC, the outlook for 2016 and 2017 remains positive; however, the booking pace for 2018 is somewhat soft. Officials note that they are actively working to replace a few larger conventions that have moved to other markets beginning in that year; however, they are optimistic that the lost room nights can be replaced with smaller corporate events that generally have a shorter booking window.
Number of Room Nights Booked Leaps Forward in 2015
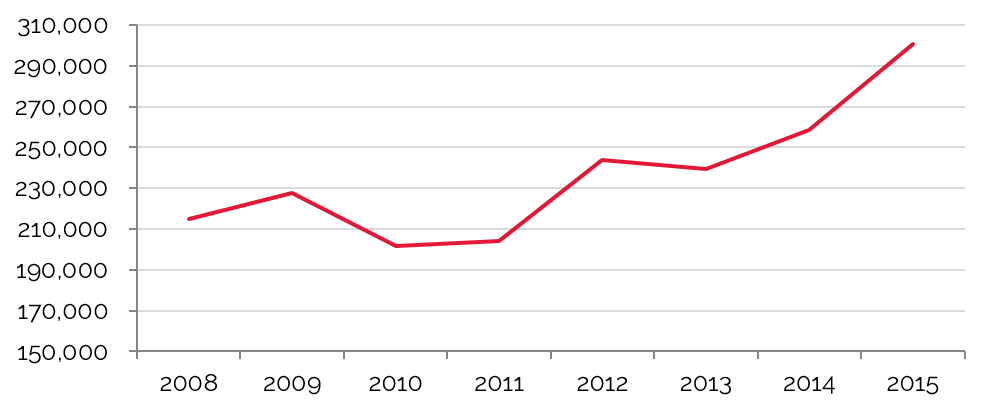
Source: Americas Center Convention Complex
Airport Traffic
Airport passenger counts are important indicators of lodging demand. Depending on the type of service provided by a particular airfield, a sizable percentage of arriving passengers may require hotel accommodations. Trends showing changes in passenger counts also reflect local business activity and the overall economic health of the area.
Lambert-St. Louis International Airport (STL) is the primary airport for St. Louis, Missouri and the surrounding area. Many major commercial airlines service the airport. In the fall of 2006, construction on a new runway was completed. A $70-million modernization program of the airport has been in progress since 2008, including updates to the security checkpoints, restrooms, ticket counters, and concourses. During the first phase of the project, which spanned from the spring of 2008 through 2010, the dome ceiling was treated, a new baggage claim system was installed, and new roadway signage was installed as part of the $1.2-million Wayfinding Project. In April 2011, Terminal 1 and Concourse C suffered extensive tornado damage. Operational disruptions were limited, as Concourse C operations were relocated to the previously under-utilized B and D concourses, and Terminal 1 immediately received temporary repairs. By mid-year 2013, the storm damage had been fully repaired; furthermore, all renovations to Concourses A and C, as well as Terminal 1, had been completed. Additionally, a multimillion-dollar upgrade to the security conveyor system was completed in late 2013. In early 2016, Southwest Airlines added two new gates in Terminal 2 in conjunction with the addition of several new flights from the airport, as well as new carpeting, signage, and jetways to Terminal 2, along with various other cosmetic updates.
STL Passenger Traffic has Stabilized
Source: Lambert St. Louis International Airport
Lambert-St. Louis International Airport was formerly a major national and international hub for American Airlines. In 2003, American significantly reduced its number of flights to and from the airport; since then, it has steadily reduced its operations at the facility. In April 2010, American ended nonstop service to 20 cities, cutting its offering of daily flights by over half and its nonstop destinations by two-thirds. In response to these cuts, other airlines have begun to step in and fill the void, stabilizing passenger levels over the last few years.
Tourist Attractions
Tourism and leisure travel to St. Louis peaks from May to September, during the typical summer travel season. The region’s wide variety of historic sites, cultural institutions, and entertainment venues, as well as its central location and reputation as a low-cost destination, make it a popular choice for vacationing families. A variety of special events throughout the year, including music and food festivals, marathons, and holiday celebrations also draw visitors to the area. Furthermore, in addition to MLB and NHL franchises, the downtown stadiums and arenas host a variety of special sporting events, such as NCAA tournaments and international soccer matches.
Busch Stadium opened in April 2006, hosting the St. Louis Cardinals' first championship season in 24 years. Every game during the stadium's first two seasons sold out, attracting Cardinals fans from across the country. The St. Louis Cardinals draw an annual regular season attendance of over three million, and team officials estimate that 40% of the attendees travel from outside the St. Louis area. Ballpark Village, an approximately 120,000-square-foot complex, opened adjacent to Busch Stadium in 2014. Ballpark Village features numerous restaurants and bars, five performance stages, the largest retractable roof of its kind in the U.S., and an outdoor festival space that re-creates the infield of the previous Busch Stadium in its exact former location.
 The Gateway Arch, which dominates the St. Louis skyline, can be seen from miles away by visitors entering the city. The 630-foot monument to westward expansion stands on the bank of the Mississippi River. The interior of the Arch is hollow and contains a unique transport system leading to an observation deck at the top. In 2013, CityArchRiver, a public-private partnership, began a $380-million renovation of the park surrounding the arch, as well as the museum beneath it. The park over Interstate 44 and the Luther Ely Smith Square project were completed in late 2015, and the new museum and visitor center at the Arch grounds should be open by 2017. All of the changes are expected to increase visitor numbers and lengths of stay in the downtown area. Local officials anticipate that visitor levels will average near 3.3 million annually, an increase of 900,000 visitors over the current average, which could have an economic impact of as much as $367 million and help create 4,400 jobs.
At nearly 1,300 acres, Forest Park has long been the jewel at the center of the St. Louis metro area. Established in 1876, Forest Park has hosted many historic events, including the 1904 World’s Fair and Olympics. Many of St. Louis' most prominent cultural institutions and tourist attractions are located in the park, including the zoo, the science center and planetarium, the art museum, and the Jefferson Memorial. A 200,000-square-foot expansion of the St. Louis Art Museum opened in July 2013, increasing the facility's public space by 30%. Additionally, LouFest, a two-day music festival held annually in Forest Park, collaborated with C3 Entertainment in 2013 to attract more national acts. The relationship has paid off, as an estimated 50,000 people from across the region gathered at LouFest in 2015, the festival's highest attendance to date.
The St. Louis area is home to six casinos along the major rivers through the region. These operations, including first-class complexes operated by Penn National, Ameristar, and Tropicana, have made greater St. Louis a regional gaming destination. The most recent addition to this sector, River City Casino, opened in 2010. In 2013, River City Casino completed an expansion that included a 200-room hotel, a 14,000-square-foot multipurpose center, and a 1,600-space covered parking structure for a total cost of $82 million.
Closing Remarks
There remain some challenges ahead for St. Louis hotels, notably the loss of passenger traffic through the airport and a moderate amount of new supply on the horizon. However, many more positives offset the potential challenges. RevPAR growth is on track to sustain a trend of steady growth through the near future. Event bookings at the convention center and related room nights improved considerably in recent years, and several major conventions are booked through 2017. The renovations surrounding the Gateway Arch are expected to increase annual visitation to St. Louis by the hundreds of thousands. The city’s casino attractions have expanded, and in the last twentyfour months, several casino hotels have sold for impressively high prices, both overall and in terms of price per room. Several of the regions major employers are in expansion modes, with further development and job growth anticipated. These developments and the city’s strong economic fundamentals support an optimistic outlook for hotel performance and values in the market.
About Daniel P. McCoy, MAI
0 Comments
Success
It will be displayed once approved by an administrator.
Thank you.
Error